Cardano price action has been lackluster over the past few weeks. It has moved within a range, facing resistance at $0.40 and finding support at $0.31. This lack of momentum is coupled with a decline in the coin’s open interest (OI), which has reached its lowest level since May 2023.
This combination of sideways price movement and falling OI is generally considered a bearish signal, suggesting that traders are losing interest in the asset and exiting their positions. That leaves one question: what can Cardano holders anticipate in the near term?
Cardano Traders Watch From the Sidelines
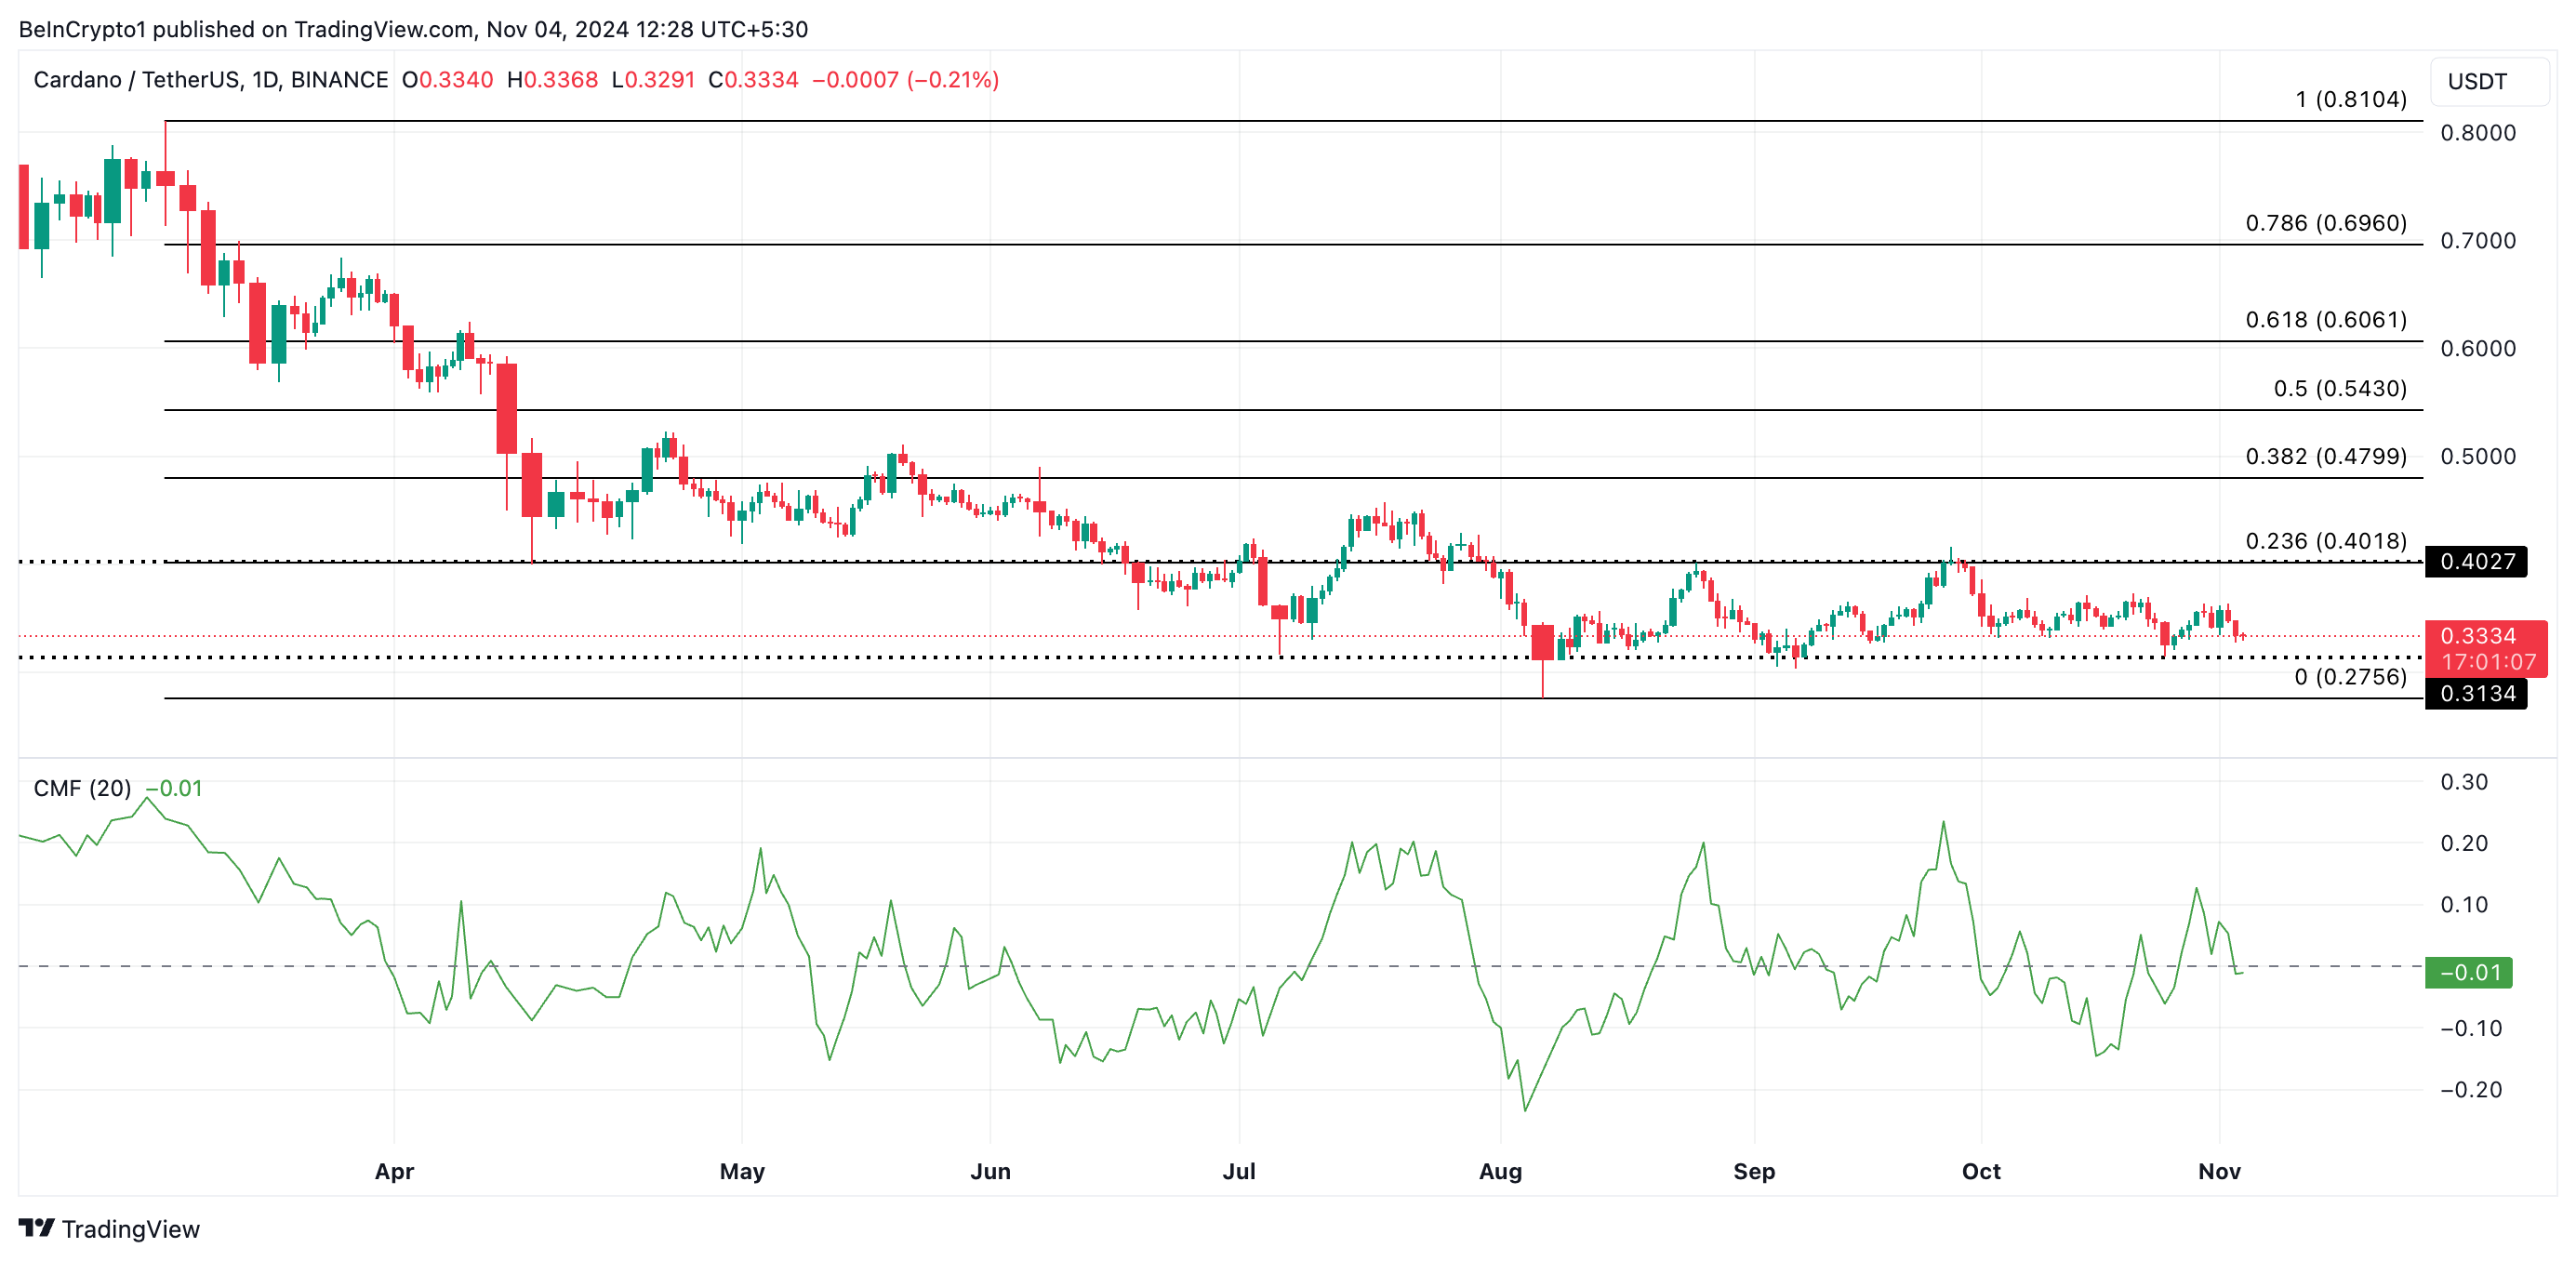
Since early August, Cardano’s price has traded within a horizontal channel. This pattern is formed when an asset’s price moves sideways between two parallel lines of support and resistance over a period of time. Buying and selling pressures are relatively balanced during this period, leading to a lack of clear directional momentum.
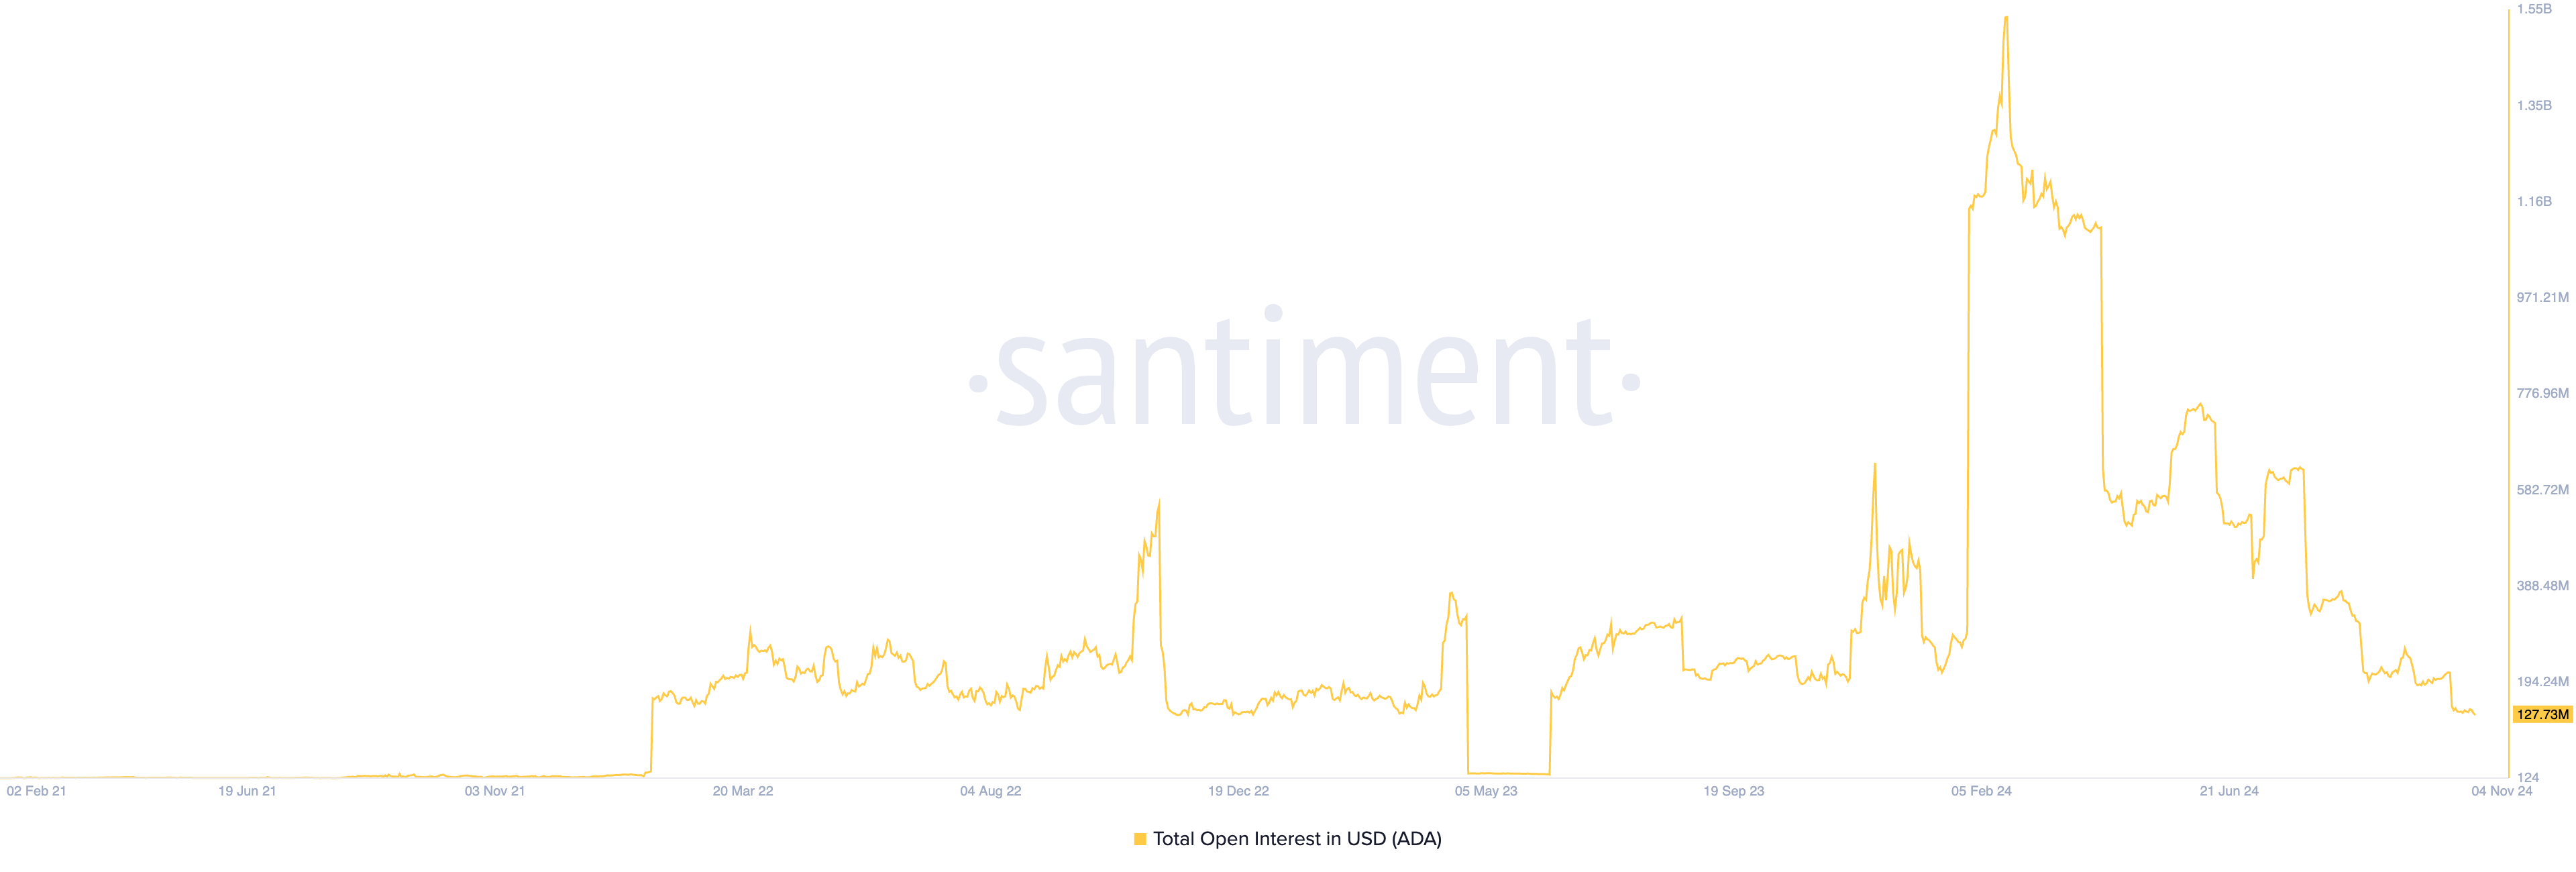
Cardano’s sideways price movements have been accompanied by a significant drop in its OI, which measures the total number of outstanding derivatives contracts (either buy or sell positions) that have not yet been settled or closed. At press time, this stood at $128 million, plummeting by 80% since early August. At its current value, ADA’s OI is at its lowest level since May 2023.
Read more: Cardano (ADA) Price Prediction 2024/2025/2030

The combination of Cardano’s flat price action and declining OI is a bearish signal. It indicates that traders are exiting the market by closing their positions. The reduction in OI means fewer participants are actively involved in trading the altcoin as its price oscillates within a range. This situation points to a lack of enthusiasm from both ADA bulls and bears, as neither side has enough confidence to push the asset strongly in either direction.
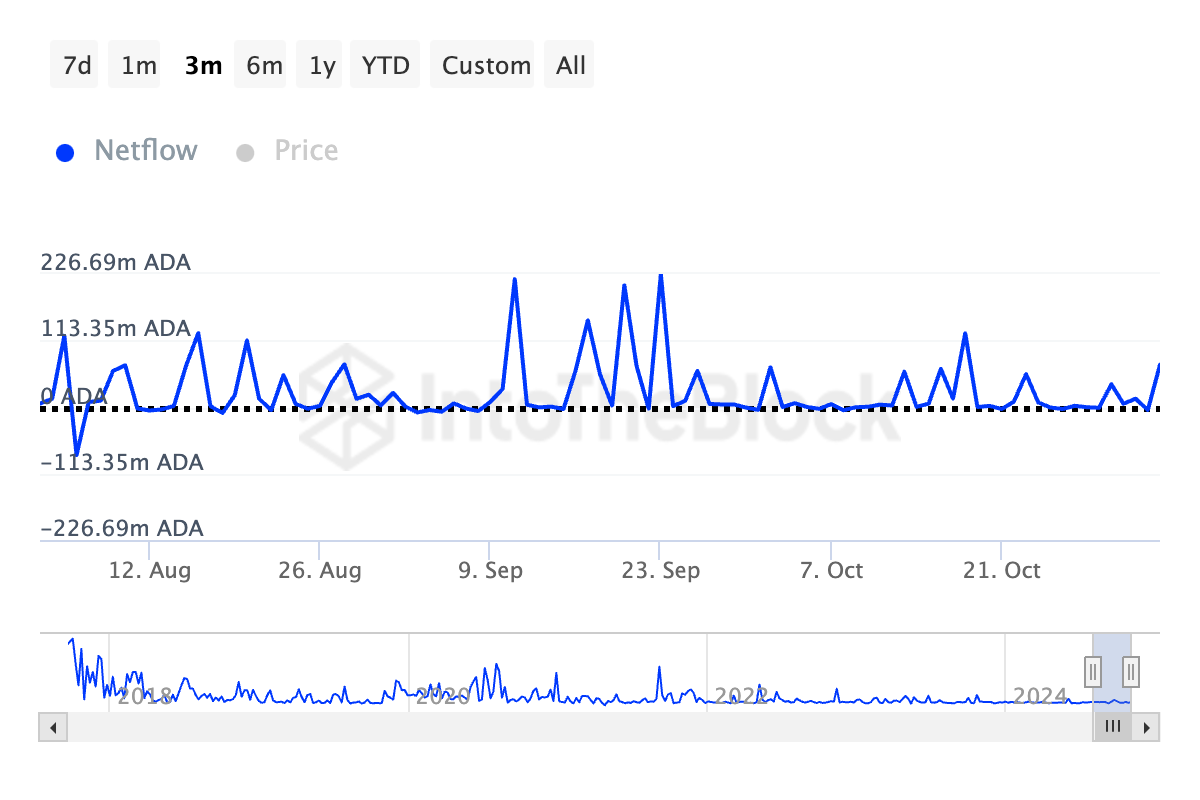
Moreover, ADA whales or large investors have increasingly sold their holdings over the past few months, as evidenced by the significant decline in the netflow of altcoin’s large holders. IntoTheBlock’s data shows that this has dropped by over 188% in the past 90 days.
Large holders are whale addresses that hold more than 0.1% of an asset’s circulating supply. When their netflow drops, it means they are selling their coins. This bearish signal may prompt retail traders to follow suit, putting more downward pressure on an asset’s price.

ADA Price Prediction: All Lies With the Bulls Now
As of this writing, Cardano is trading at $0.33. It hovers slightly above its established support level of $0.31. Waning buying pressure, as reflected by ADA’s negative Chaikin Money Flow (CMF) indicator, suggests a possible move lower toward this support. At press time, ADA’s CMF stands at -0.01, indicating that selling activity outweighs buying pressure.
The CMF, which measures the money flow into and out of an asset, indicates market strength or weakness. A negative CMF reading signals a period of selling dominance.
If ADA bulls fail to defend the $0.31 support and the price breaks below the lower boundary of the horizontal channel, the downtrend will be confirmed. This could lead Cardano’s price to fall to $0.27.
Read more: How To Buy Cardano (ADA) and Everything You Need To Know

Conversely, if sentiment shifts positively and ADA sees renewed demand, it may attempt to break the upper line of the horizontal channel at $0.41. A successful breakout could spark a rally toward $0.54, a high not seen since April.
Cardano price action has been lackluster over the past few weeks. It has moved within a range, facing resistance at $0.40 and finding support at $0.31. This lack of momentum is coupled with a decline in the coin’s open interest (OI), which has reached its lowest level since May 2023.
This combination of sideways price movement and falling OI is generally considered a bearish signal, suggesting that traders are losing interest in the asset and exiting their positions. That leaves one question: what can Cardano holders anticipate in the near term?
Cardano Traders Watch From the Sidelines
Since early August, Cardano’s price has traded within a horizontal channel. This pattern is formed when an asset’s price moves sideways between two parallel lines of support and resistance over a period of time. Buying and selling pressures are relatively balanced during this period, leading to a lack of clear directional momentum.
Cardano’s sideways price movements have been accompanied by a significant drop in its OI, which measures the total number of outstanding derivatives contracts (either buy or sell positions) that have not yet been settled or closed. At press time, this stood at $128 million, plummeting by 80% since early August. At its current value, ADA’s OI is at its lowest level since May 2023.
Read more: Cardano (ADA) Price Prediction 2024/2025/2030

The combination of Cardano’s flat price action and declining OI is a bearish signal. It indicates that traders are exiting the market by closing their positions. The reduction in OI means fewer participants are actively involved in trading the altcoin as its price oscillates within a range. This situation points to a lack of enthusiasm from both ADA bulls and bears, as neither side has enough confidence to push the asset strongly in either direction.
Moreover, ADA whales or large investors have increasingly sold their holdings over the past few months, as evidenced by the significant decline in the netflow of altcoin’s large holders. IntoTheBlock’s data shows that this has dropped by over 188% in the past 90 days.
Large holders are whale addresses that hold more than 0.1% of an asset’s circulating supply. When their netflow drops, it means they are selling their coins. This bearish signal may prompt retail traders to follow suit, putting more downward pressure on an asset’s price.

ADA Price Prediction: All Lies With the Bulls Now
As of this writing, Cardano is trading at $0.33. It hovers slightly above its established support level of $0.31. Waning buying pressure, as reflected by ADA’s negative Chaikin Money Flow (CMF) indicator, suggests a possible move lower toward this support. At press time, ADA’s CMF stands at -0.01, indicating that selling activity outweighs buying pressure.
The CMF, which measures the money flow into and out of an asset, indicates market strength or weakness. A negative CMF reading signals a period of selling dominance.
If ADA bulls fail to defend the $0.31 support and the price breaks below the lower boundary of the horizontal channel, the downtrend will be confirmed. This could lead Cardano’s price to fall to $0.27.
Read more: How To Buy Cardano (ADA) and Everything You Need To Know

Conversely, if sentiment shifts positively and ADA sees renewed demand, it may attempt to break the upper line of the horizontal channel at $0.41. A successful breakout could spark a rally toward $0.54, a high not seen since April.


