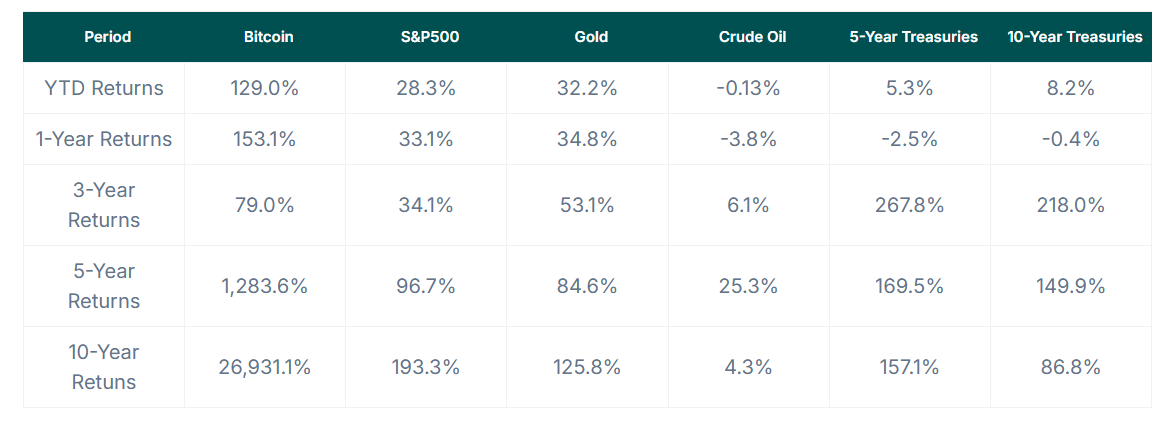
Bitcoin has delivered an astonishing 26,931% return over the past decade, far surpassing the S&P 500’s 193.3% and gold’s 125.8%, despite its notable volatility.
A recent study shared by CoinGecko, an independent crypto data aggregator, highlights Bitcoin’s remarkable performance while examining its evolving correlation with the S&P 500, gold, and other major assets.
Despite its fluctuations, Bitcoin emerged as a top-performing asset, demonstrating significant growth, particularly during specific economic cycles.
Bitcoin Outpaces Other Assets
Over the last 10 years, Bitcoin has posted an extraordinary return of 26,931%, far outpacing traditional investment assets. A $100 investment in 2014 would now be worth over $26,900, emphasizing Bitcoin’s transformative growth.
In comparison, the S&P 500, a key equity benchmark, achieved a 193.3% return over the same period. Gold, widely regarded as a stable store of value, posted a 125.8% gain.
Treasuries also maintained relevance, with 5-year bonds delivering 157.1% returns and 10-year Treasuries returning 86.8%. In contrast, crude oil lagged significantly, offering a modest 4.3% return over the decade.
The year-to-date (YTD) data for 2024 reinforces Bitcoin’s dominance. It delivered 129.0% returns, followed by gold at 32.2%. The S&P 500 also showed strength, with 28.3% growth.
Bonds and crude oil offered comparatively weaker performance. While 5-year Treasuries provided 5.3%, and 10-year bonds delivered 8.2%, crude oil declined slightly by -0.13%.

Shifting Correlations with S&P 500 and Gold
Bitcoin’s relationship with the S&P 500 has evolved significantly over the years. Before 2018, its correlation with equity markets hovered near zero. However, this changed around 2020, particularly during global economic events like the COVID-19 pandemic. Bitcoin’s price began aligning more closely with stock market performance during these periods.
In contrast, Bitcoin’s correlation with gold has remained inconsistent. While both assets are considered alternatives to traditional investments, their relationship often moves inversely.
When Bitcoin’s price rises, its correlation with gold tends to decline and vice versa. This pattern suggests that investors may shift toward gold when Bitcoin underperforms. Occasionally, brief periods of correlation emerge during macroeconomic uncertainties, signaling shared responses to market conditions.
Volatility and Cyclical Trends
Bitcoin’s extraordinary gains have come with significant volatility, marked by sharp price swings over the last decade. Historical data indicates two major bull cycles in 2017-2018 and 2020-2021, driven by Bitcoin’s halving events that occur every four years.
During these periods, Bitcoin prices surged to record highs before experiencing steep declines exceeding 70% of their peaks.
Bitcoin’s price range highlights this volatility. It has traded as low as $172.15 and peaked at $107,780. During this press, the crypto is trading at $107,440, a 3.67% rise in the past 24 hours.
Bitcoin has delivered an astonishing 26,931% return over the past decade, far surpassing the S&P 500’s 193.3% and gold’s 125.8%, despite its notable volatility.
A recent study shared by CoinGecko, an independent crypto data aggregator, highlights Bitcoin’s remarkable performance while examining its evolving correlation with the S&P 500, gold, and other major assets.
Despite its fluctuations, Bitcoin emerged as a top-performing asset, demonstrating significant growth, particularly during specific economic cycles.
Bitcoin Outpaces Other Assets
Over the last 10 years, Bitcoin has posted an extraordinary return of 26,931%, far outpacing traditional investment assets. A $100 investment in 2014 would now be worth over $26,900, emphasizing Bitcoin’s transformative growth.
In comparison, the S&P 500, a key equity benchmark, achieved a 193.3% return over the same period. Gold, widely regarded as a stable store of value, posted a 125.8% gain.
Treasuries also maintained relevance, with 5-year bonds delivering 157.1% returns and 10-year Treasuries returning 86.8%. In contrast, crude oil lagged significantly, offering a modest 4.3% return over the decade.
The year-to-date (YTD) data for 2024 reinforces Bitcoin’s dominance. It delivered 129.0% returns, followed by gold at 32.2%. The S&P 500 also showed strength, with 28.3% growth.
Bonds and crude oil offered comparatively weaker performance. While 5-year Treasuries provided 5.3%, and 10-year bonds delivered 8.2%, crude oil declined slightly by -0.13%.

Shifting Correlations with S&P 500 and Gold
Bitcoin’s relationship with the S&P 500 has evolved significantly over the years. Before 2018, its correlation with equity markets hovered near zero. However, this changed around 2020, particularly during global economic events like the COVID-19 pandemic. Bitcoin’s price began aligning more closely with stock market performance during these periods.
In contrast, Bitcoin’s correlation with gold has remained inconsistent. While both assets are considered alternatives to traditional investments, their relationship often moves inversely.
When Bitcoin’s price rises, its correlation with gold tends to decline and vice versa. This pattern suggests that investors may shift toward gold when Bitcoin underperforms. Occasionally, brief periods of correlation emerge during macroeconomic uncertainties, signaling shared responses to market conditions.
Volatility and Cyclical Trends
Bitcoin’s extraordinary gains have come with significant volatility, marked by sharp price swings over the last decade. Historical data indicates two major bull cycles in 2017-2018 and 2020-2021, driven by Bitcoin’s halving events that occur every four years.
During these periods, Bitcoin prices surged to record highs before experiencing steep declines exceeding 70% of their peaks.
Bitcoin’s price range highlights this volatility. It has traded as low as $172.15 and peaked at $107,780. During this press, the crypto is trading at $107,440, a 3.67% rise in the past 24 hours.


