Ethereum (ETH) lost its three-year support against Bitcoin (BTC) as the most prominent cryptocurrency rallied towards its $100,000 target on Friday, November 22. ETH has faced sticky resistance at $3,500 for nearly four months while competitors hit record highs this cycle.
Table of Contents
Ethereum loses favour with institutional investors, ETF performance lacklustre
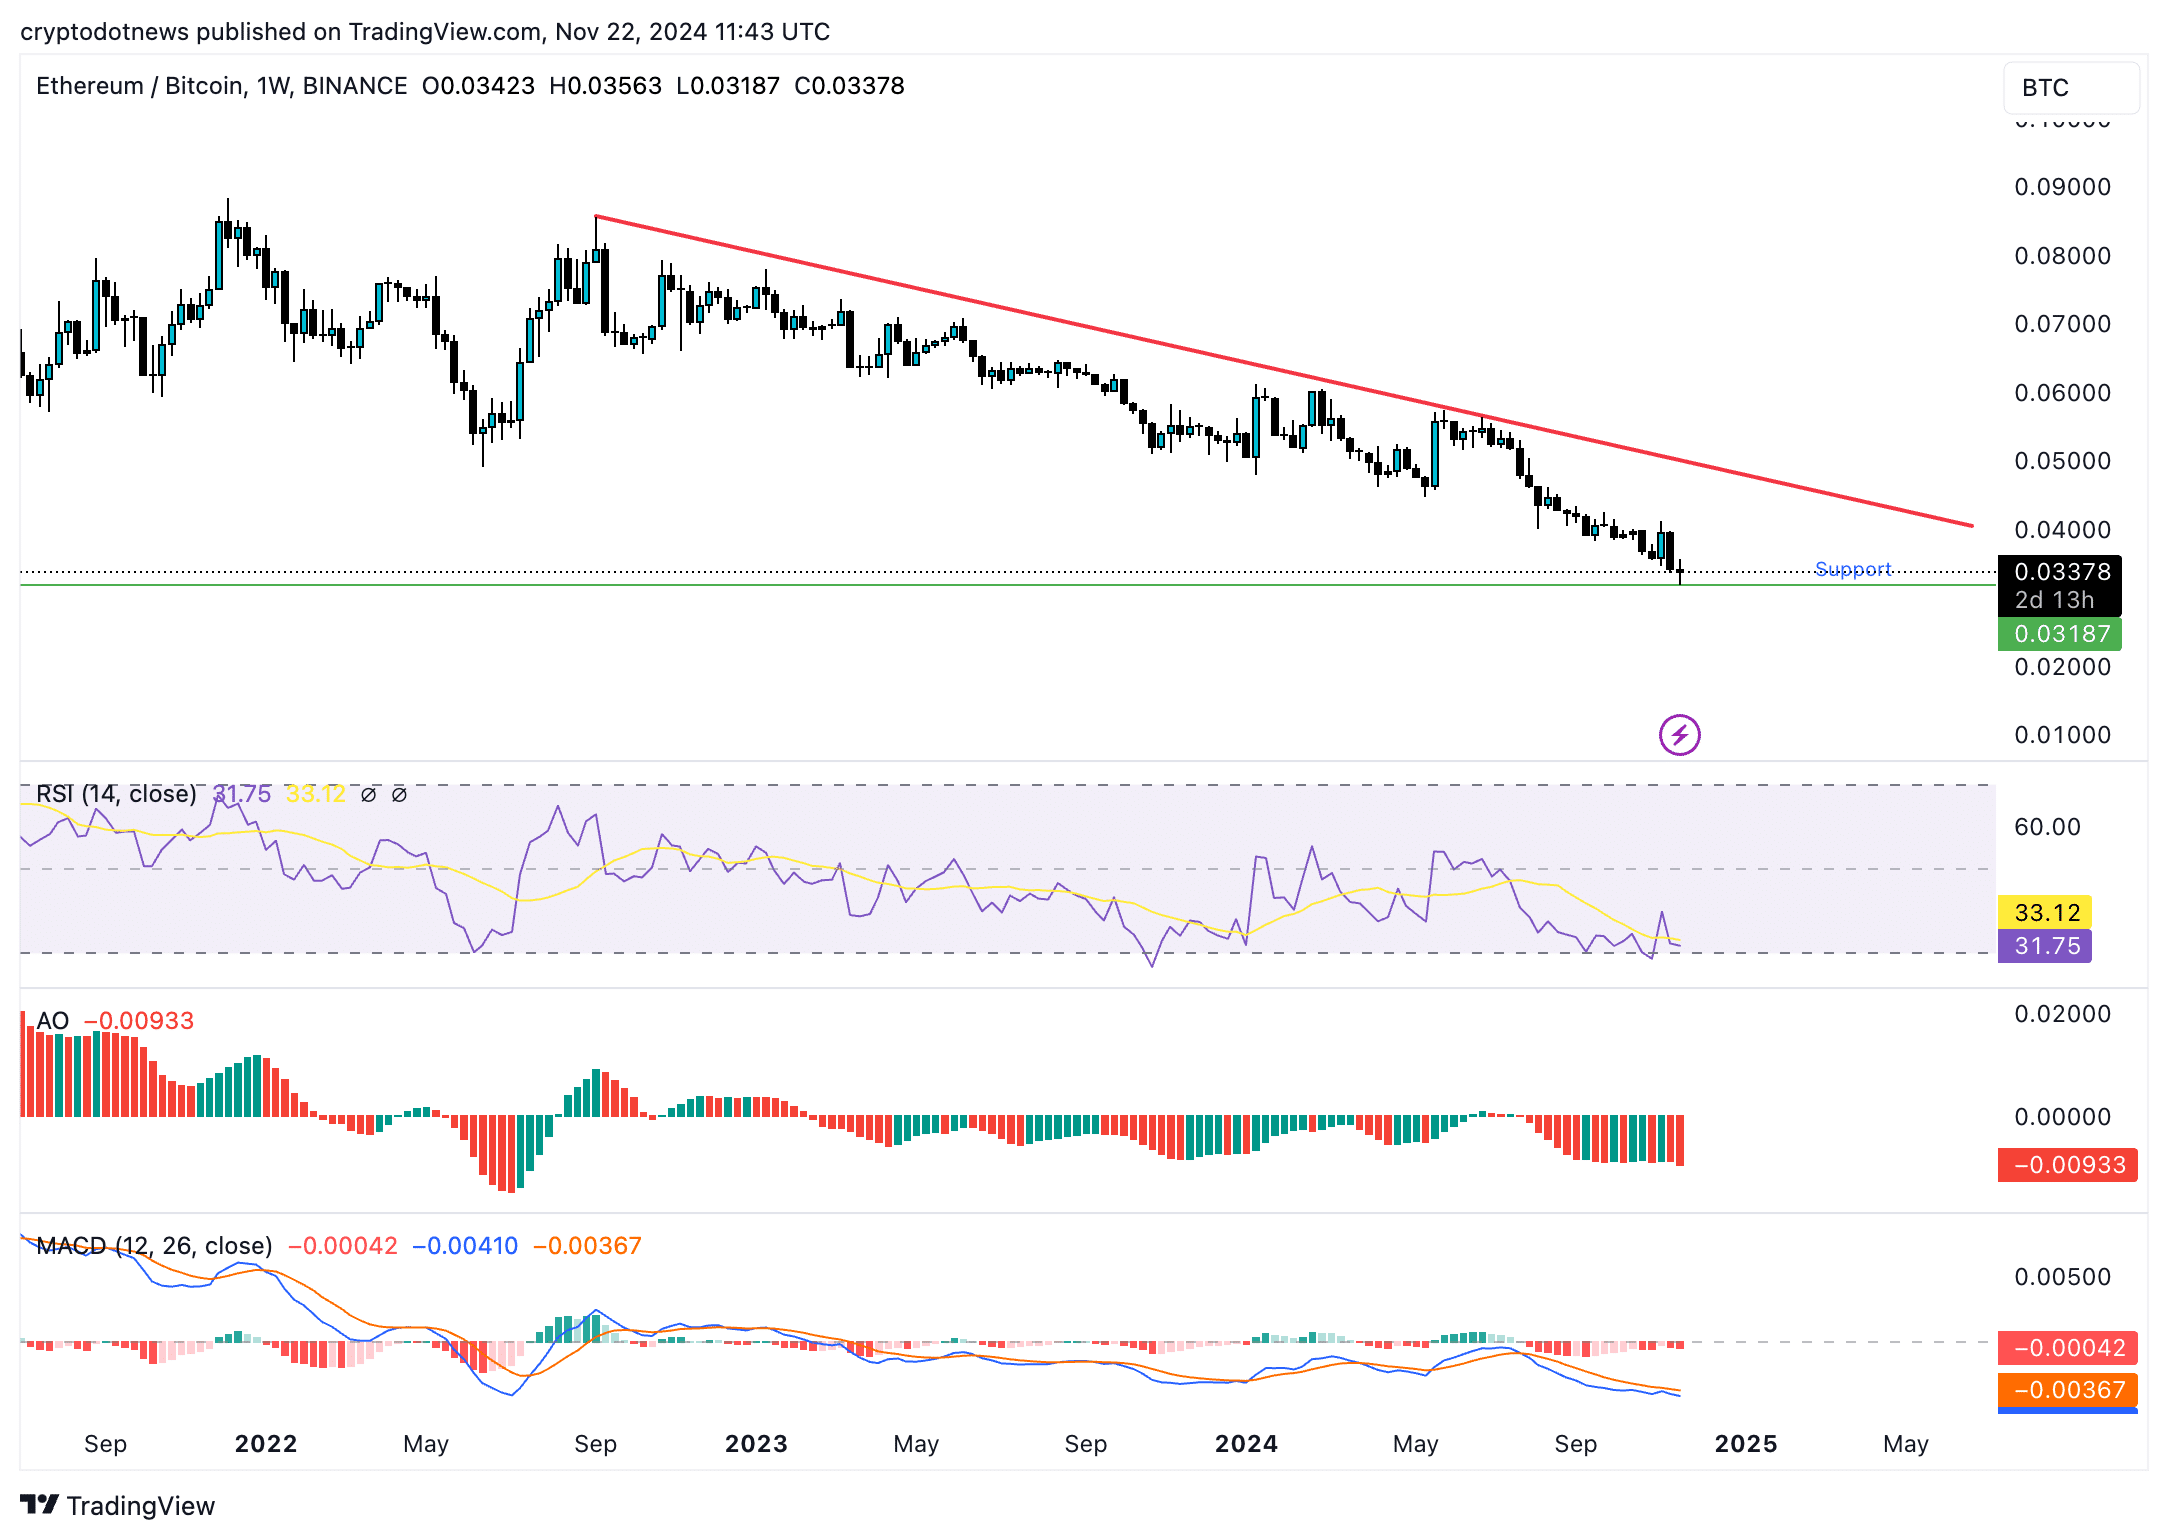
Ethereum slipped to a low of 0.03187 against Bitcoin on Friday, November 22. As Bitcoin made its way towards the $100,000 target, Ethereum price dropped under the support level that was maintained for nearly three years since 2021.
Ethereum’s decline against Bitcoin is likely a culmination of several factors, including a lack of interest from institutional investors, a steady decline in interest from retail investors, and the shift of capital and attention to Layer 2 and Layer 3 scaling projects, among others.
The performance of the Ethereum Spot ETF explains how the altcoin has failed to garner investment from institutions while Bitcoin Spot ETF continues to outperform.
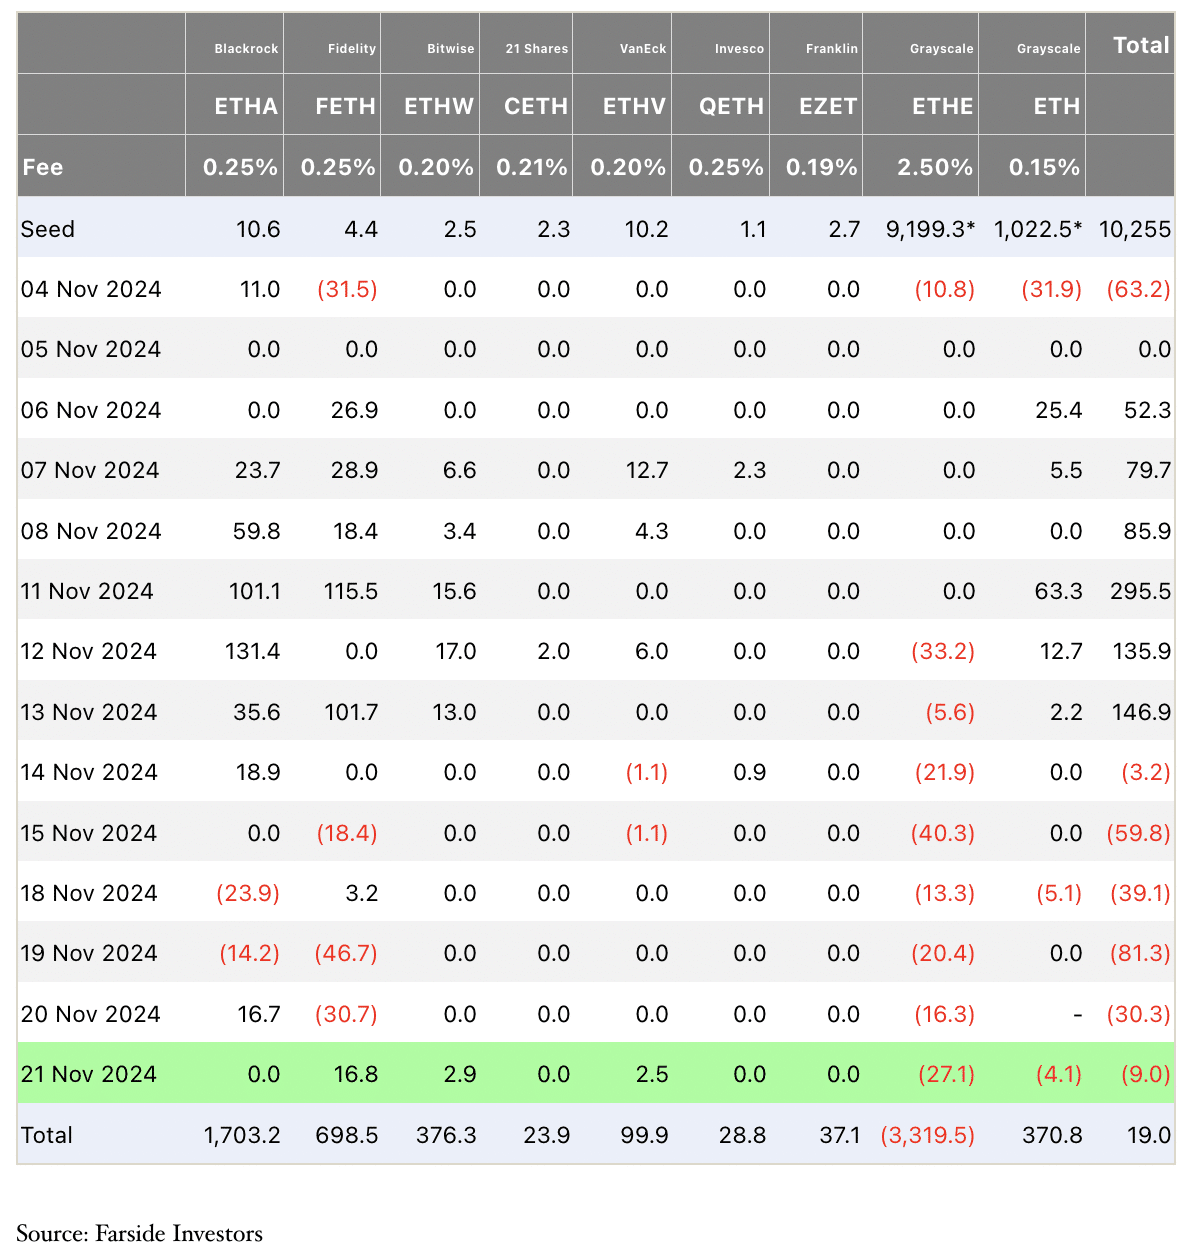
Data from Farside Investors UK shows that ETH ETFs have noted net negative flows or outflows for the past six days. In contrast, Bitcoin Spot ETFs continue to attract billions of dollars in institutional fund flows.

Tuur Demeester, Editor-in-Chief of Adamant Research, told Forbes that Ethereum might be “dying a slow death,” signalling the shift in market dynamics and the slowdown in institutional adoptions.
Solana challenges Ethereum’s dominance, on-chain analysis
While Ethereum ETF performance struggles, the altcoin faces a challenge from its competitor, Solana (SOL). Solana’s market capitalization gain and price rally pushed SOL to the top four cryptocurrencies, per CoinGecko.

Solana dominates Ethereum in terms of transaction volume across decentralized exchange platforms, DEX activity and protocol fees generated in October 2024 and November 2024.
While Ethereum’s price has climbed on Thursday and Friday this week, the altcoin struggles with resistance at $3,500, and a failure to break past this level could challenge the likelihood of further gains in the token.
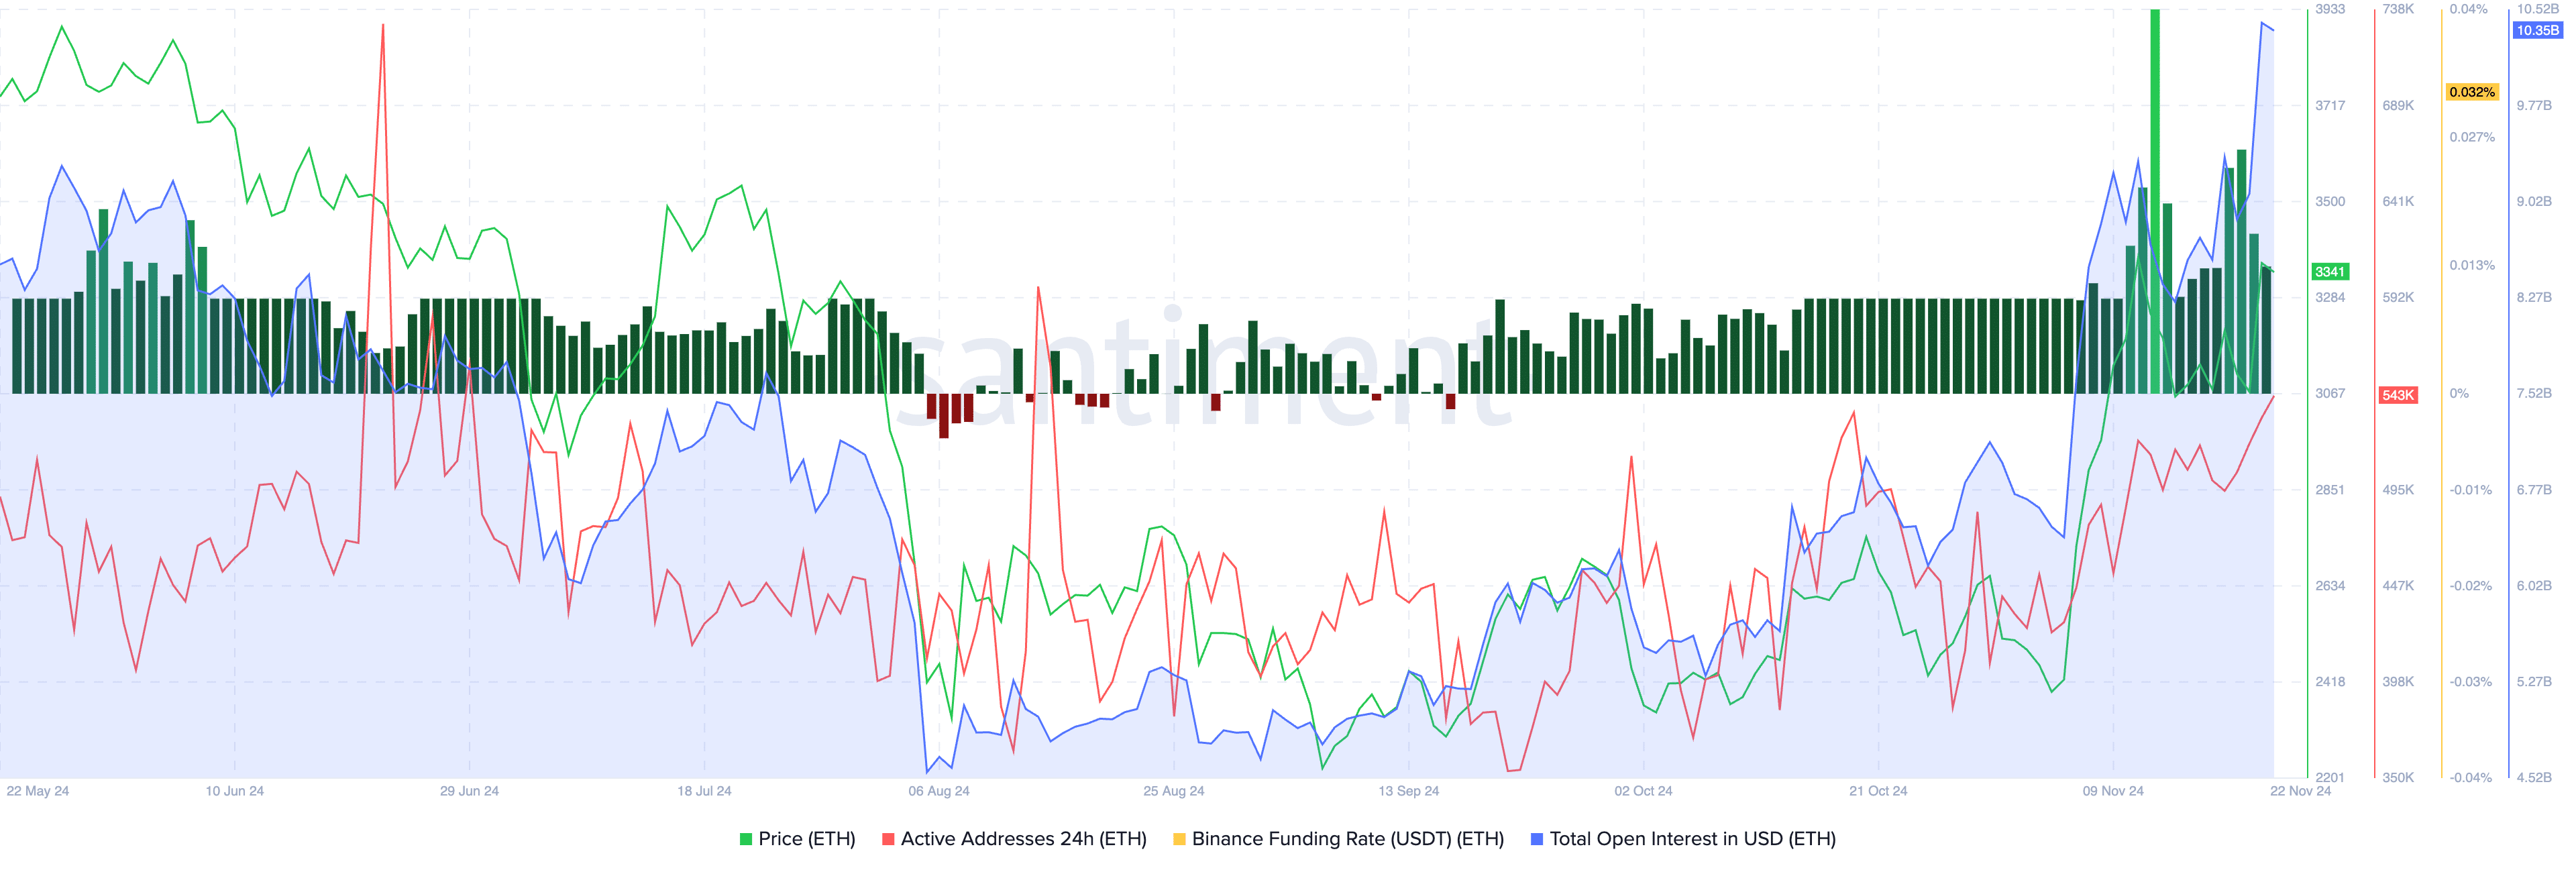
On-chain metrics are inconclusive. While active addresses remain well below mid-August 2024 levels, the funding rate on Binance has been consistently positive since mid-September 2024.
Open interest in Ethereum futures, a metric that gauges interest and demand among derivatives traders, climbed to $10.35 billion, per Santiment data. Statistics from derivatives markets support a bullish thesis for the altcoin. Combined with the recent increase in Ether price, further gains are likely if the altcoin successfully breaches resistance at $3,500.

Bitcoin leads cryptos with digital gold narrative
Ethereum is the second largest altcoin, and for the better part of the last decade, the two cryptocurrencies have been spoken of together by analysts and traders. However, Bitcoin has stepped into the role of “digital gold”, or a token used to hedge against geopolitical crises and unpredictable events in the market. At the same time, Ethereum is faced with scalability issues.
Ethereum’s scalability issues gave way to the Layer 2 and Layer 3 protocols, and their tokens have yielded gains for traders in 2024. However, the base chain is slowly losing its appeal and traction among market participants.
The digital gold narrative drew institutional attention from nations that deemed it fit to add Bitcoin to their balance sheet, while Ethereum is still working on its promise of being a “decentralized computer” to the world.
While Ethereum has a larger market capitalization than Bank of America, as of November 22, the altcoin is yet to witness gains in the current market cycle relative to meme coins and other cryptocurrencies like Solana.
Ethereum future expectations and technical analysis
ETH/BTC slipped to a near three-year low, down to a critical support level, as seen in the chart below. The decline is significant, and the pair has been trending downward since September of 2023.
Technical indicators like relative strength index and momentum indicators support a bearish thesis. RSI is 31, close to the “oversold” zone under 30. This typically generates a buy signal for traders, meaning that the asset is undervalued and is a good time to buy for sidelined traders.
Failure to recover from the support level could lead to a further decline in the pair, with ETH/BTC slipping lower in the next few weeks of 2024.

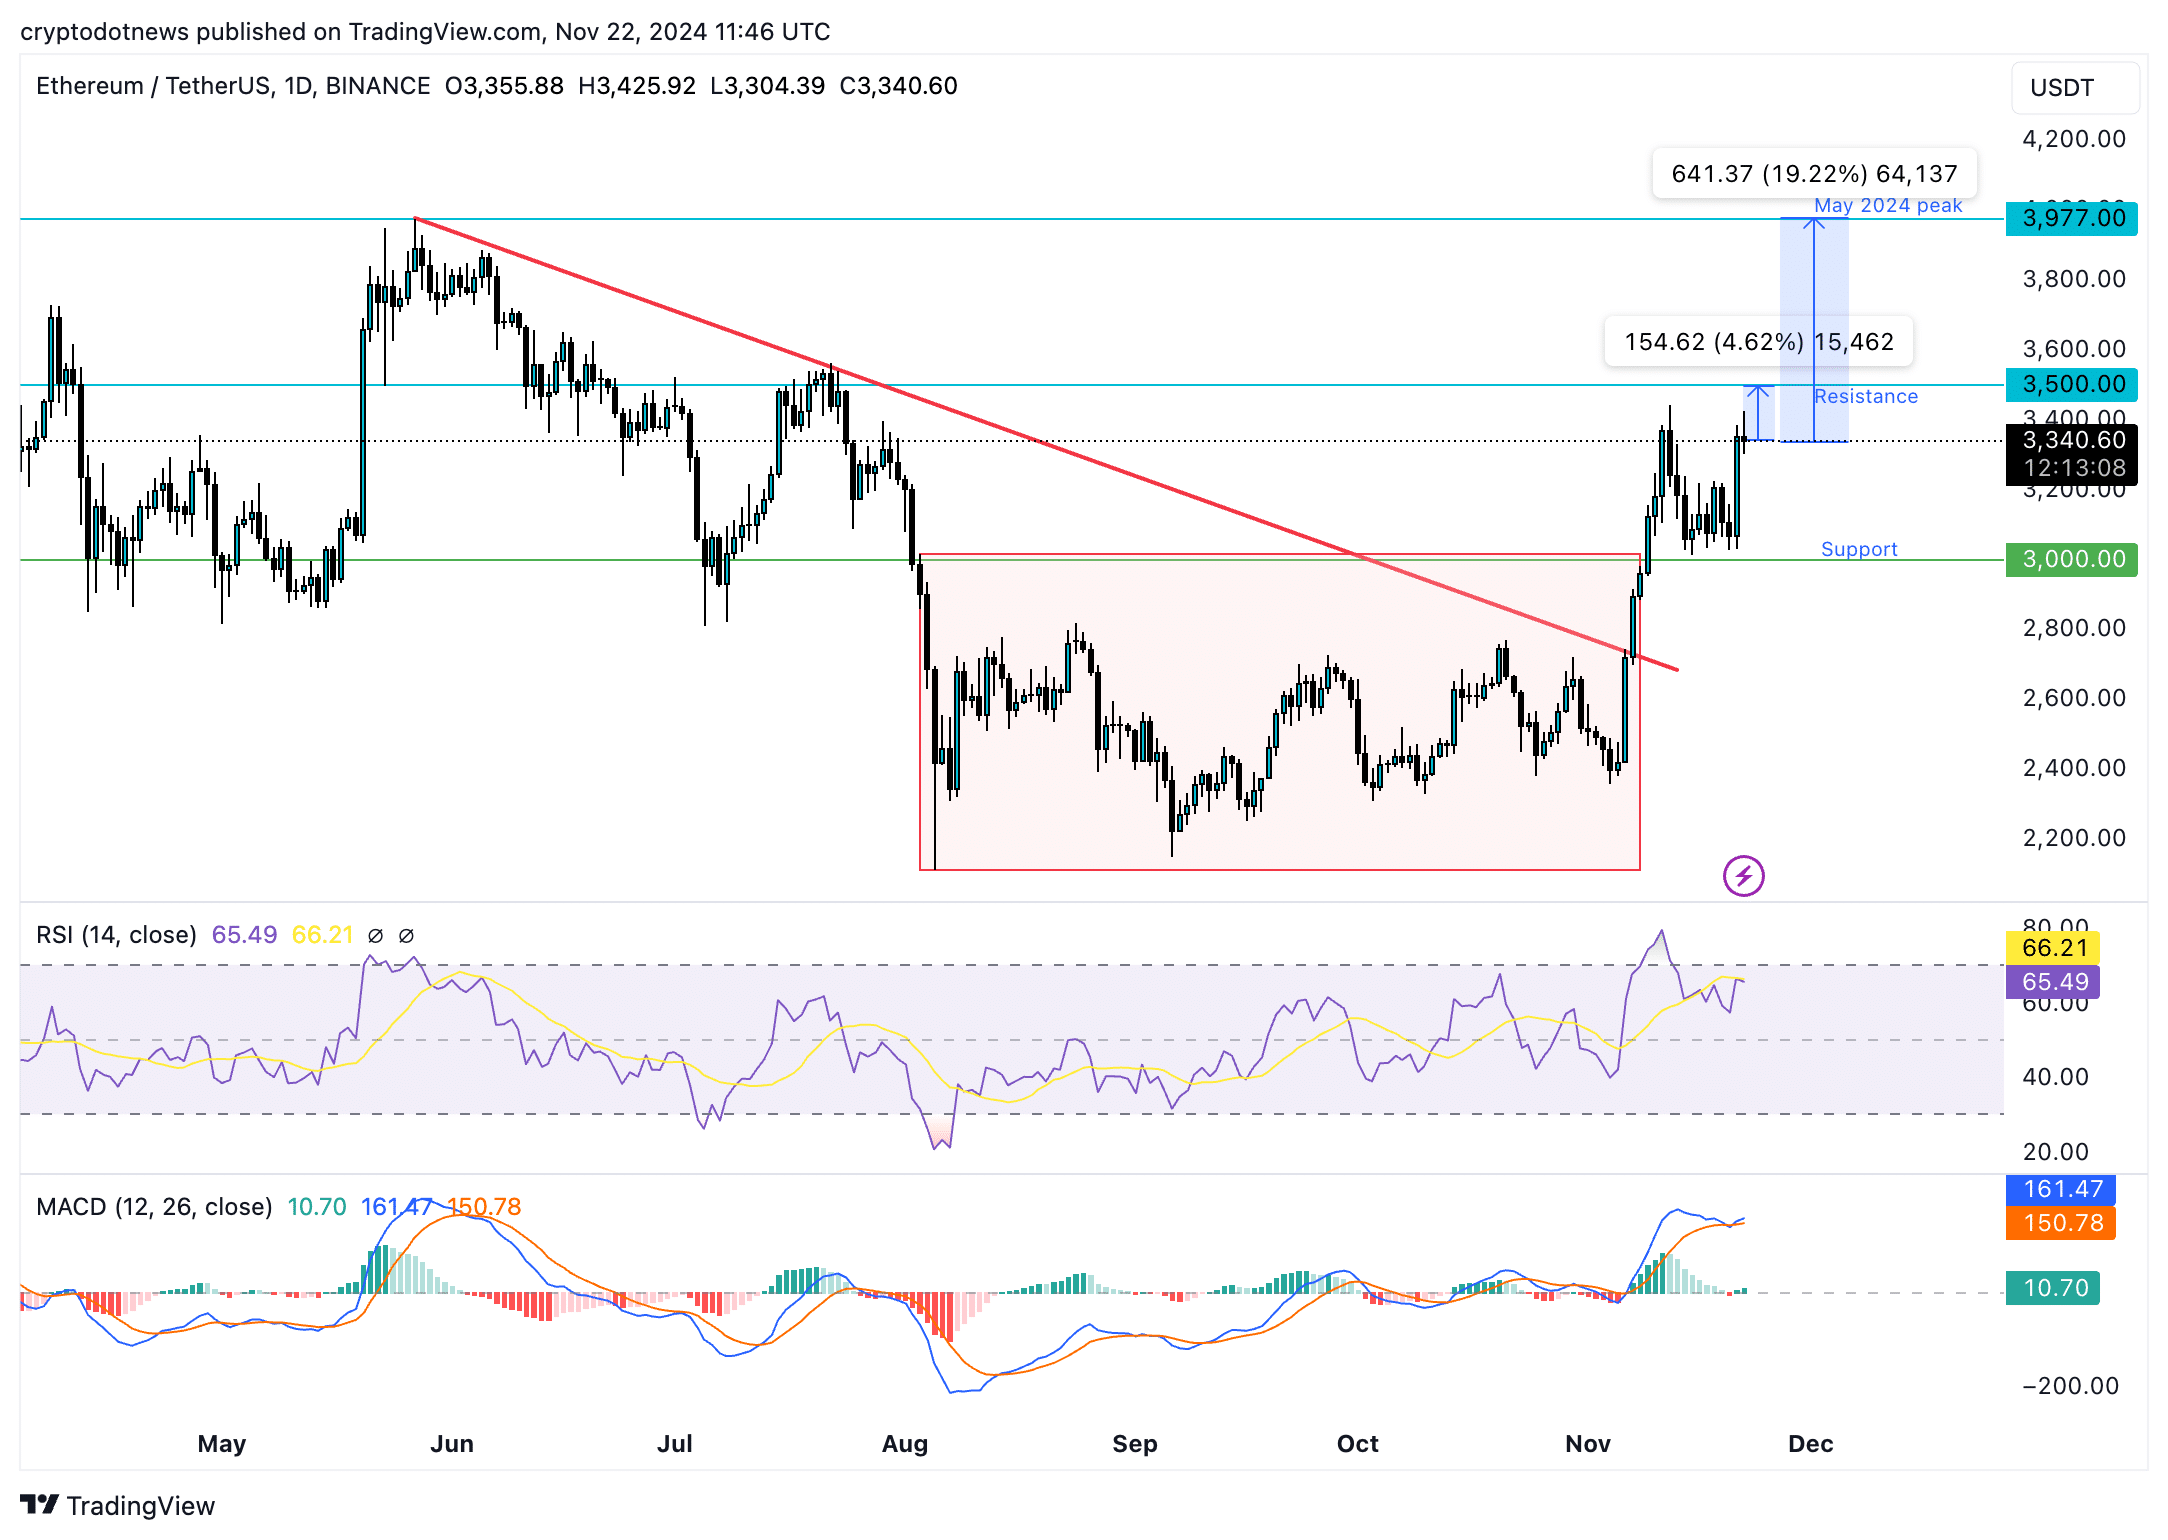
The ETH/USDT daily price chart shows positive signs for the altcoin. ETH price could observe gains and rally towards the $3,500 resistance and the May 2024 peak of $3,977 if the altcoin maintains its upward momentum.
Ethereum is less than 5% away from the $3,500, and nearly 20% gains could send ETH to test the $3,977 May 2024 peak. RSI is 65, well below the overvalued level above 70. The green histogram bars on the moving average convergence divergence indicator support a likelihood of further gains in Ethereum.
Ethereum’s underlying price trend is positive, and if the altcoin maintains its steady climb, the $4,000, a psychologically important price level, could be breached in the short term.

A correction could send Ethereum to test support at $3,000, a key support level for the altcoin throughout 2024. Further decline would mean Ethereum finds support at the lower boundary of the range at $2,111, as seen on the daily price chart.
Strategic considerations
Ethereum enjoys a strong correlation with Bitcoin, at 0.91, according to Macroaxis.com. This implies that a significant spike in Bitcoin price could be followed by gains in Ethereum and the altcoin’s price is expected to observe a positive impact.
While Ethereum lags compared to its peers, a correction in Bitcoin could add to the challenges faced by the altcoin in its uphill battle with resistance at $3,500. Traders need to monitor the volume of options and open interest in Ethereum before adding to their positions in ETH.
Disclosure: This article does not represent investment advice. The content and materials featured on this page are for educational purposes only.
Ethereum (ETH) lost its three-year support against Bitcoin (BTC) as the most prominent cryptocurrency rallied towards its $100,000 target on Friday, November 22. ETH has faced sticky resistance at $3,500 for nearly four months while competitors hit record highs this cycle.
Table of Contents
Ethereum loses favour with institutional investors, ETF performance lacklustre
Ethereum slipped to a low of 0.03187 against Bitcoin on Friday, November 22. As Bitcoin made its way towards the $100,000 target, Ethereum price dropped under the support level that was maintained for nearly three years since 2021.
Ethereum’s decline against Bitcoin is likely a culmination of several factors, including a lack of interest from institutional investors, a steady decline in interest from retail investors, and the shift of capital and attention to Layer 2 and Layer 3 scaling projects, among others.
The performance of the Ethereum Spot ETF explains how the altcoin has failed to garner investment from institutions while Bitcoin Spot ETF continues to outperform.
Data from Farside Investors UK shows that ETH ETFs have noted net negative flows or outflows for the past six days. In contrast, Bitcoin Spot ETFs continue to attract billions of dollars in institutional fund flows.

Tuur Demeester, Editor-in-Chief of Adamant Research, told Forbes that Ethereum might be “dying a slow death,” signalling the shift in market dynamics and the slowdown in institutional adoptions.
Solana challenges Ethereum’s dominance, on-chain analysis
While Ethereum ETF performance struggles, the altcoin faces a challenge from its competitor, Solana (SOL). Solana’s market capitalization gain and price rally pushed SOL to the top four cryptocurrencies, per CoinGecko.

Solana dominates Ethereum in terms of transaction volume across decentralized exchange platforms, DEX activity and protocol fees generated in October 2024 and November 2024.
While Ethereum’s price has climbed on Thursday and Friday this week, the altcoin struggles with resistance at $3,500, and a failure to break past this level could challenge the likelihood of further gains in the token.
On-chain metrics are inconclusive. While active addresses remain well below mid-August 2024 levels, the funding rate on Binance has been consistently positive since mid-September 2024.
Open interest in Ethereum futures, a metric that gauges interest and demand among derivatives traders, climbed to $10.35 billion, per Santiment data. Statistics from derivatives markets support a bullish thesis for the altcoin. Combined with the recent increase in Ether price, further gains are likely if the altcoin successfully breaches resistance at $3,500.

Bitcoin leads cryptos with digital gold narrative
Ethereum is the second largest altcoin, and for the better part of the last decade, the two cryptocurrencies have been spoken of together by analysts and traders. However, Bitcoin has stepped into the role of “digital gold”, or a token used to hedge against geopolitical crises and unpredictable events in the market. At the same time, Ethereum is faced with scalability issues.
Ethereum’s scalability issues gave way to the Layer 2 and Layer 3 protocols, and their tokens have yielded gains for traders in 2024. However, the base chain is slowly losing its appeal and traction among market participants.
The digital gold narrative drew institutional attention from nations that deemed it fit to add Bitcoin to their balance sheet, while Ethereum is still working on its promise of being a “decentralized computer” to the world.
While Ethereum has a larger market capitalization than Bank of America, as of November 22, the altcoin is yet to witness gains in the current market cycle relative to meme coins and other cryptocurrencies like Solana.
Ethereum future expectations and technical analysis
ETH/BTC slipped to a near three-year low, down to a critical support level, as seen in the chart below. The decline is significant, and the pair has been trending downward since September of 2023.
Technical indicators like relative strength index and momentum indicators support a bearish thesis. RSI is 31, close to the “oversold” zone under 30. This typically generates a buy signal for traders, meaning that the asset is undervalued and is a good time to buy for sidelined traders.
Failure to recover from the support level could lead to a further decline in the pair, with ETH/BTC slipping lower in the next few weeks of 2024.

The ETH/USDT daily price chart shows positive signs for the altcoin. ETH price could observe gains and rally towards the $3,500 resistance and the May 2024 peak of $3,977 if the altcoin maintains its upward momentum.
Ethereum is less than 5% away from the $3,500, and nearly 20% gains could send ETH to test the $3,977 May 2024 peak. RSI is 65, well below the overvalued level above 70. The green histogram bars on the moving average convergence divergence indicator support a likelihood of further gains in Ethereum.
Ethereum’s underlying price trend is positive, and if the altcoin maintains its steady climb, the $4,000, a psychologically important price level, could be breached in the short term.

A correction could send Ethereum to test support at $3,000, a key support level for the altcoin throughout 2024. Further decline would mean Ethereum finds support at the lower boundary of the range at $2,111, as seen on the daily price chart.
Strategic considerations
Ethereum enjoys a strong correlation with Bitcoin, at 0.91, according to Macroaxis.com. This implies that a significant spike in Bitcoin price could be followed by gains in Ethereum and the altcoin’s price is expected to observe a positive impact.
While Ethereum lags compared to its peers, a correction in Bitcoin could add to the challenges faced by the altcoin in its uphill battle with resistance at $3,500. Traders need to monitor the volume of options and open interest in Ethereum before adding to their positions in ETH.
Disclosure: This article does not represent investment advice. The content and materials featured on this page are for educational purposes only.


