Ethereum price consolidated above the $3,400 territory on July 24, as the newly-launched ETF recorded $1 billion inflows on the first day of trading in the US, technical indicators highlight how ETH could react.
Ethereum Holds $3,400 Support Amid Sell-the-New Pressure
On July 23, 2024, Ethereum ETFs began trading officially across US-regulated derivatives markets and exchanges. Ahead of the landmark event, many speculative traders took a cautious position on ETH, wary that investors looking to sell-in-the euphoria could trigger massive downswings.
However, after the first day of Ethereum ETFs trading, the daily ETH/USD price chart flashes mixed signals.

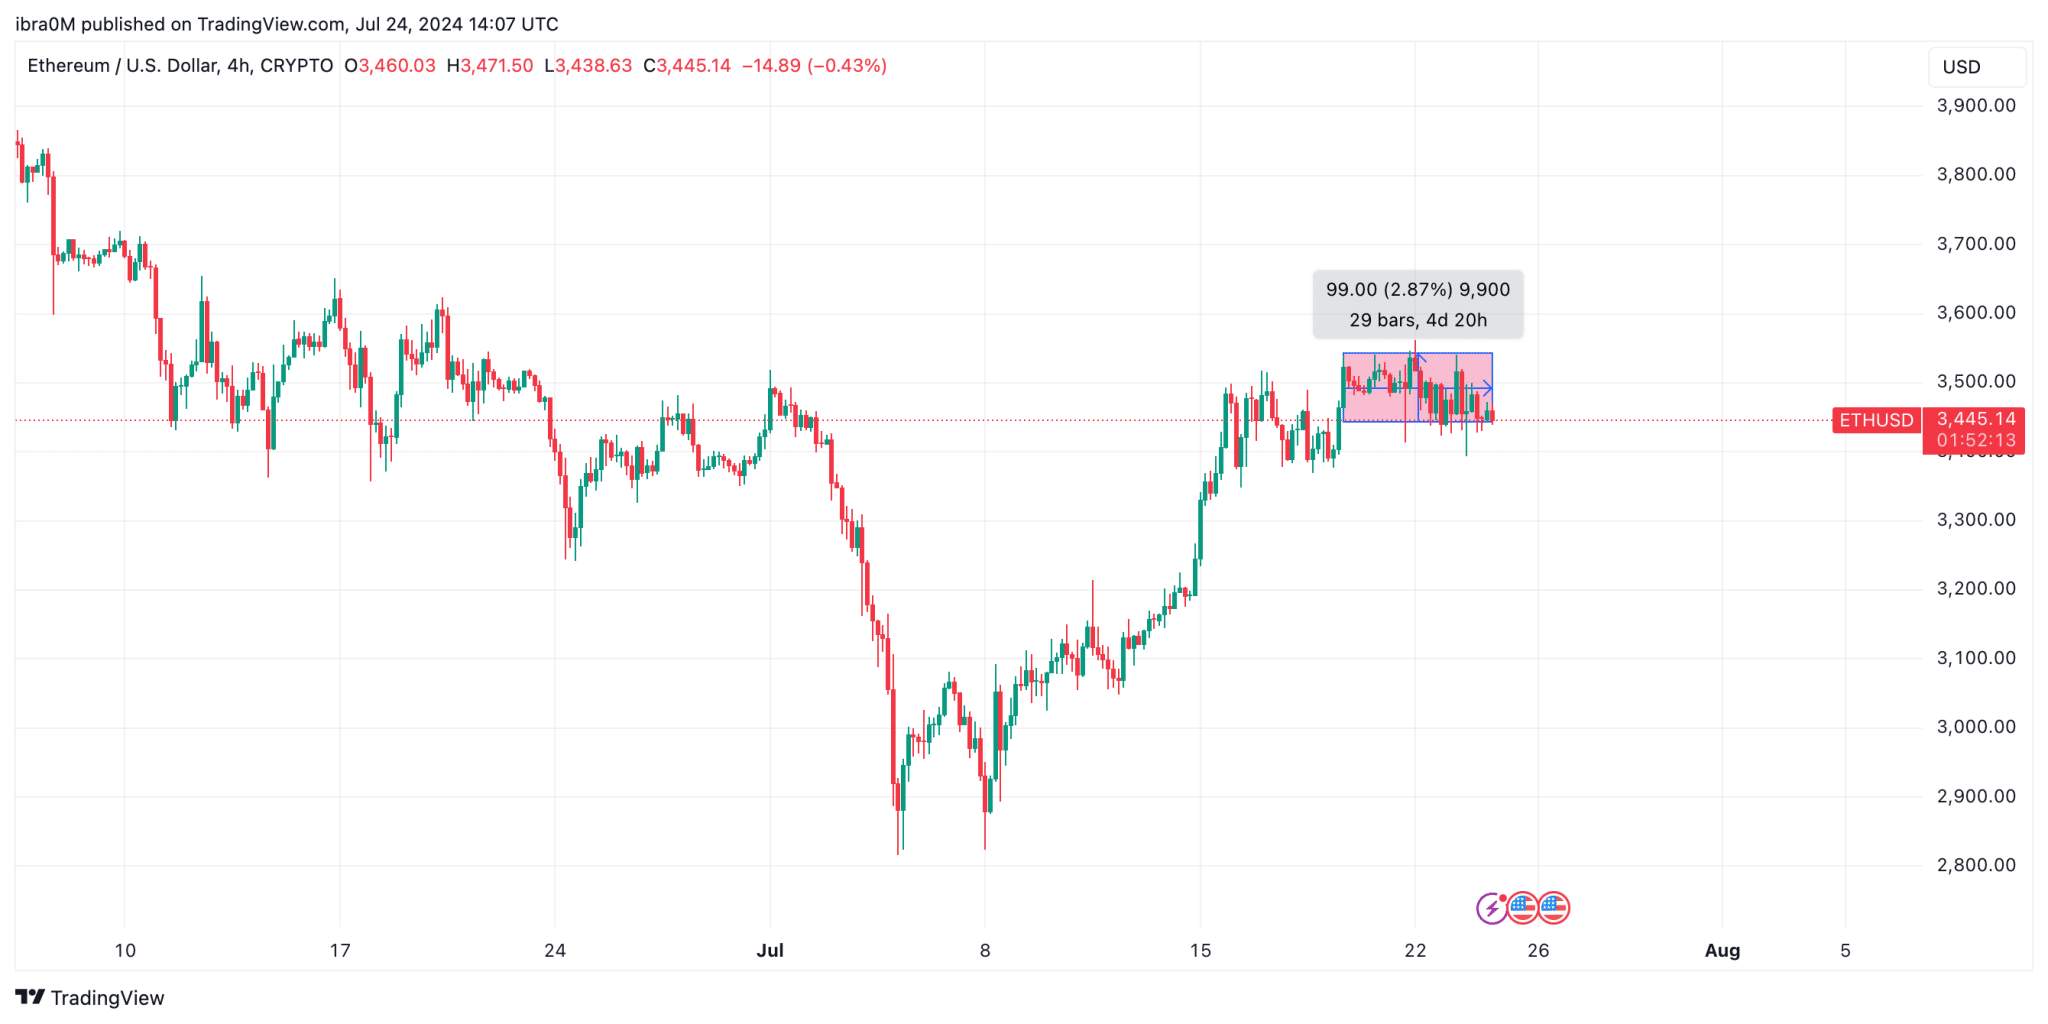
Ethereum price is hovering above the $3,445 area at the time of writing on July 24. However, a closer look at the chart shows that since Friday, July 19, ETH has consolidated within the 3% narrow channel between $3,420 and $3,580.
Such a tight consolidation often indicates a counteraction of bearish and bullish catalysts active within the ETH markets. While swing traders sold after their ETFs trading approval hype, inflows from the new institutional players kept propping up prices and preventing major downside.
Ethereum ETF Pulls $1 Billion on First Day of Trading
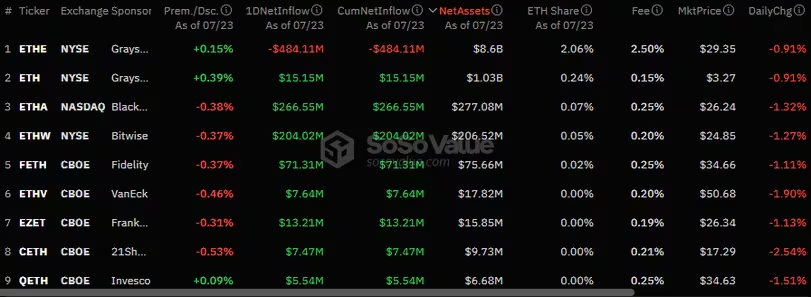
On the first day of trading, Ether ETF volumes pushed past $1 billion on the first day of trading, with $106.78 million in net flow.
In comparison, the bitcoin ETFs had $4.5 billion in trading volume on their first day and $600 million in net flow.

On the first day of trading, Ethereum exchange-traded funds (ETFs) saw remarkable activity, with volumes surpassing $1 billion and a net inflow of $106.78 million. This is equivalent to 20% of Bitcoin ETFs’ $4.5 billion first trading volume and $600 million net inflows.
BlackRock’s iShares Ethereum Trust ETF led with $266.5 million in inflows, followed by Bitwise’s Ethereum ETF at $204 million.
Despite substantial activity, the trading volume for Ethereum ETFs was about 20% of what Bitcoin ETFs achieved on their launch day. Market experts had anticipated a lower volume for Ethereum ETFs due to the absence of a staking mechanism.
This strong first day performance explains why Ethereum price managed to avoid a breakdown below $3,400 level on July 24, amid the sell-the-news frenzy that has ensued in the last 24 hours.
Ethereum Price Forecast: $3,600 Target Now in Sight
Having defended the $3,400 amid intense market activity on July 24, Ethereum’s price now appears on the verge of a major breakout above $3,600.
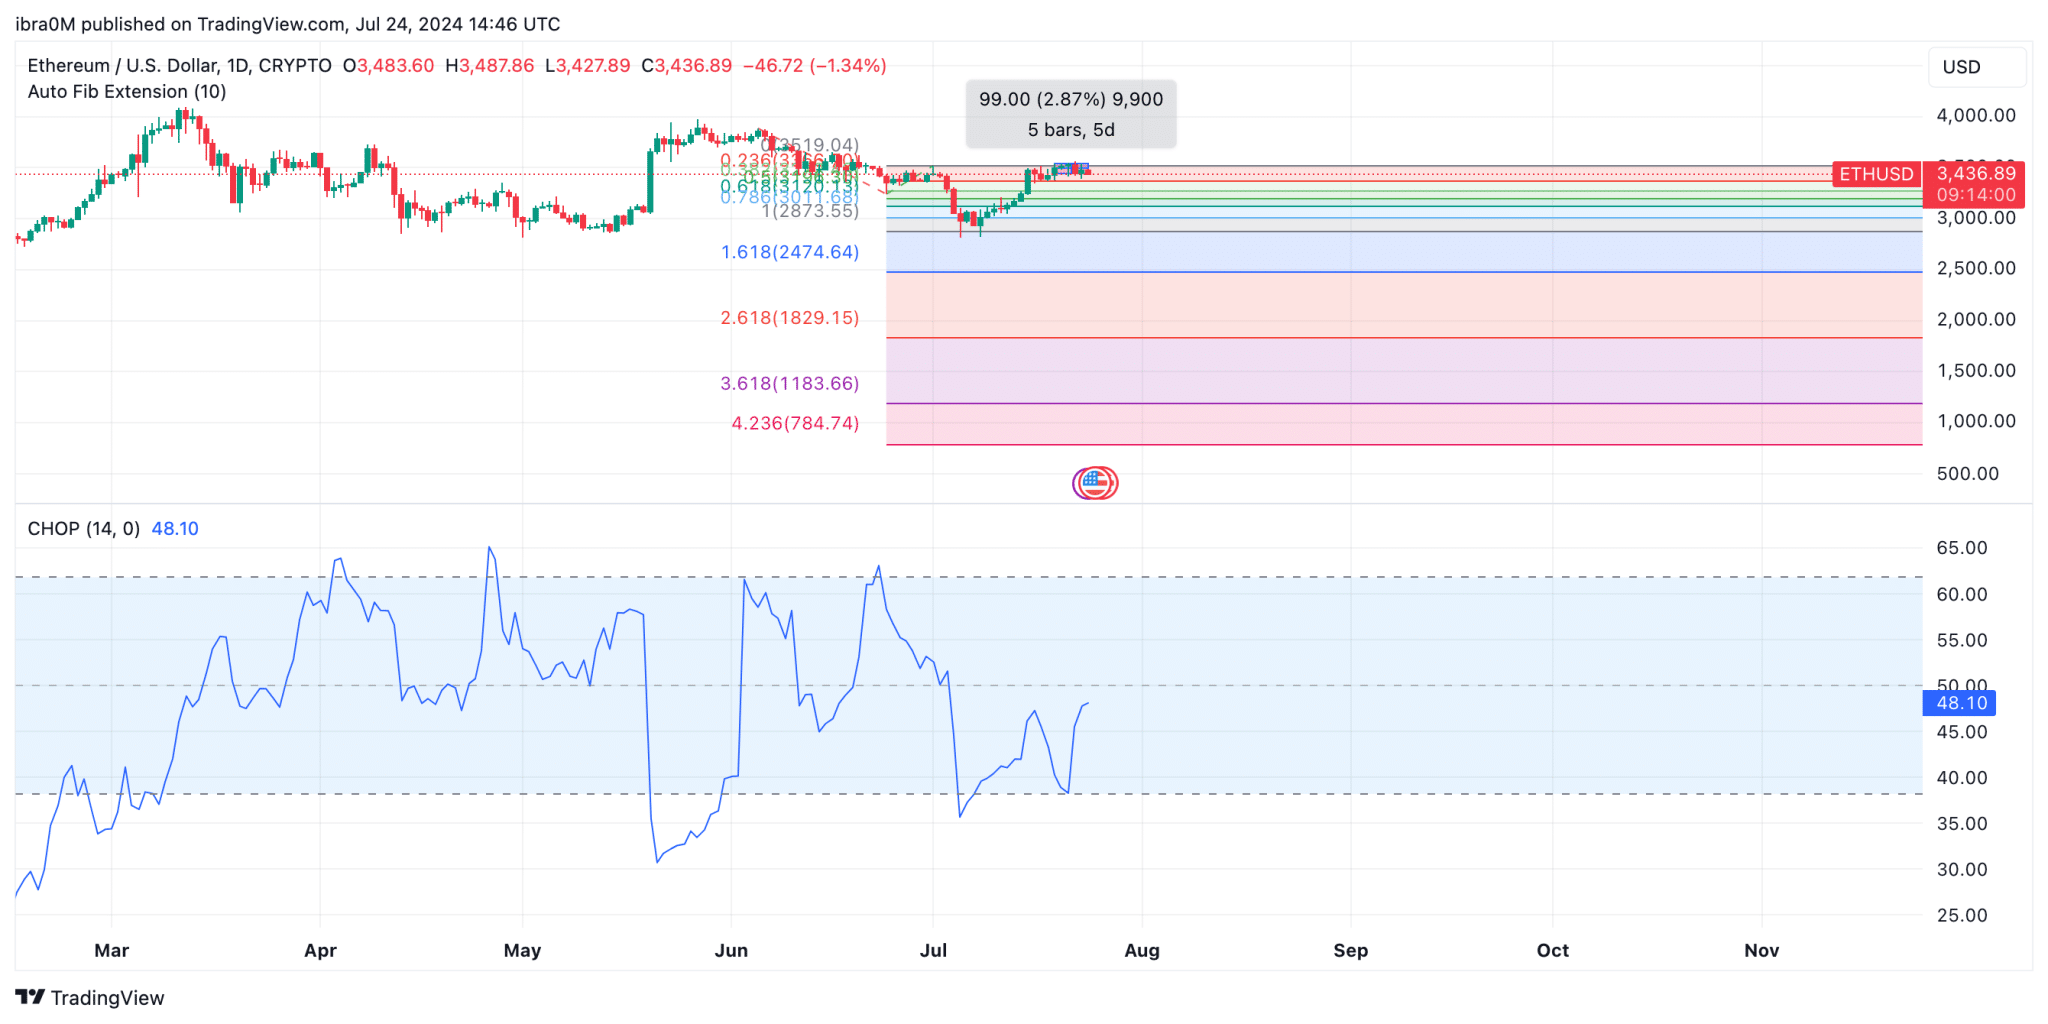
The Ethereum price is currently trading around $3,436.89, with bears displaying a strong resistance level at $3,519.04. The bullish momentum indicates a potential rally towards $3,600, driven by the support provided by the 0.618 Fibonacci retracement level at $3,312.75.

However, if the price fails to break above this resistance, it may find support at $3,312.75. Below this, further support lies at $2,747.64. The Choppiness Index (CHOP) at 48.10 suggests that the market is in a neutral state, indicating possible consolidation before any significant movement.
Traders should watch for a decisive move above $3,519.04, which could pave the way for a climb to $3,600. Conversely, a breakdown below the $3,312.75 support could trigger a decline towards the $2,747.64 level.
Ethereum price consolidated above the $3,400 territory on July 24, as the newly-launched ETF recorded $1 billion inflows on the first day of trading in the US, technical indicators highlight how ETH could react.
Ethereum Holds $3,400 Support Amid Sell-the-New Pressure
On July 23, 2024, Ethereum ETFs began trading officially across US-regulated derivatives markets and exchanges. Ahead of the landmark event, many speculative traders took a cautious position on ETH, wary that investors looking to sell-in-the euphoria could trigger massive downswings.
However, after the first day of Ethereum ETFs trading, the daily ETH/USD price chart flashes mixed signals.

Ethereum price is hovering above the $3,445 area at the time of writing on July 24. However, a closer look at the chart shows that since Friday, July 19, ETH has consolidated within the 3% narrow channel between $3,420 and $3,580.
Such a tight consolidation often indicates a counteraction of bearish and bullish catalysts active within the ETH markets. While swing traders sold after their ETFs trading approval hype, inflows from the new institutional players kept propping up prices and preventing major downside.
Ethereum ETF Pulls $1 Billion on First Day of Trading
On the first day of trading, Ether ETF volumes pushed past $1 billion on the first day of trading, with $106.78 million in net flow.
In comparison, the bitcoin ETFs had $4.5 billion in trading volume on their first day and $600 million in net flow.

On the first day of trading, Ethereum exchange-traded funds (ETFs) saw remarkable activity, with volumes surpassing $1 billion and a net inflow of $106.78 million. This is equivalent to 20% of Bitcoin ETFs’ $4.5 billion first trading volume and $600 million net inflows.
BlackRock’s iShares Ethereum Trust ETF led with $266.5 million in inflows, followed by Bitwise’s Ethereum ETF at $204 million.
Despite substantial activity, the trading volume for Ethereum ETFs was about 20% of what Bitcoin ETFs achieved on their launch day. Market experts had anticipated a lower volume for Ethereum ETFs due to the absence of a staking mechanism.
This strong first day performance explains why Ethereum price managed to avoid a breakdown below $3,400 level on July 24, amid the sell-the-news frenzy that has ensued in the last 24 hours.
Ethereum Price Forecast: $3,600 Target Now in Sight
Having defended the $3,400 amid intense market activity on July 24, Ethereum’s price now appears on the verge of a major breakout above $3,600.
The Ethereum price is currently trading around $3,436.89, with bears displaying a strong resistance level at $3,519.04. The bullish momentum indicates a potential rally towards $3,600, driven by the support provided by the 0.618 Fibonacci retracement level at $3,312.75.

However, if the price fails to break above this resistance, it may find support at $3,312.75. Below this, further support lies at $2,747.64. The Choppiness Index (CHOP) at 48.10 suggests that the market is in a neutral state, indicating possible consolidation before any significant movement.
Traders should watch for a decisive move above $3,519.04, which could pave the way for a climb to $3,600. Conversely, a breakdown below the $3,312.75 support could trigger a decline towards the $2,747.64 level.


