A closely followed crypto strategist believes that Bitcoin (BTC) is gearing up to witness its third parabolic run this cycle.
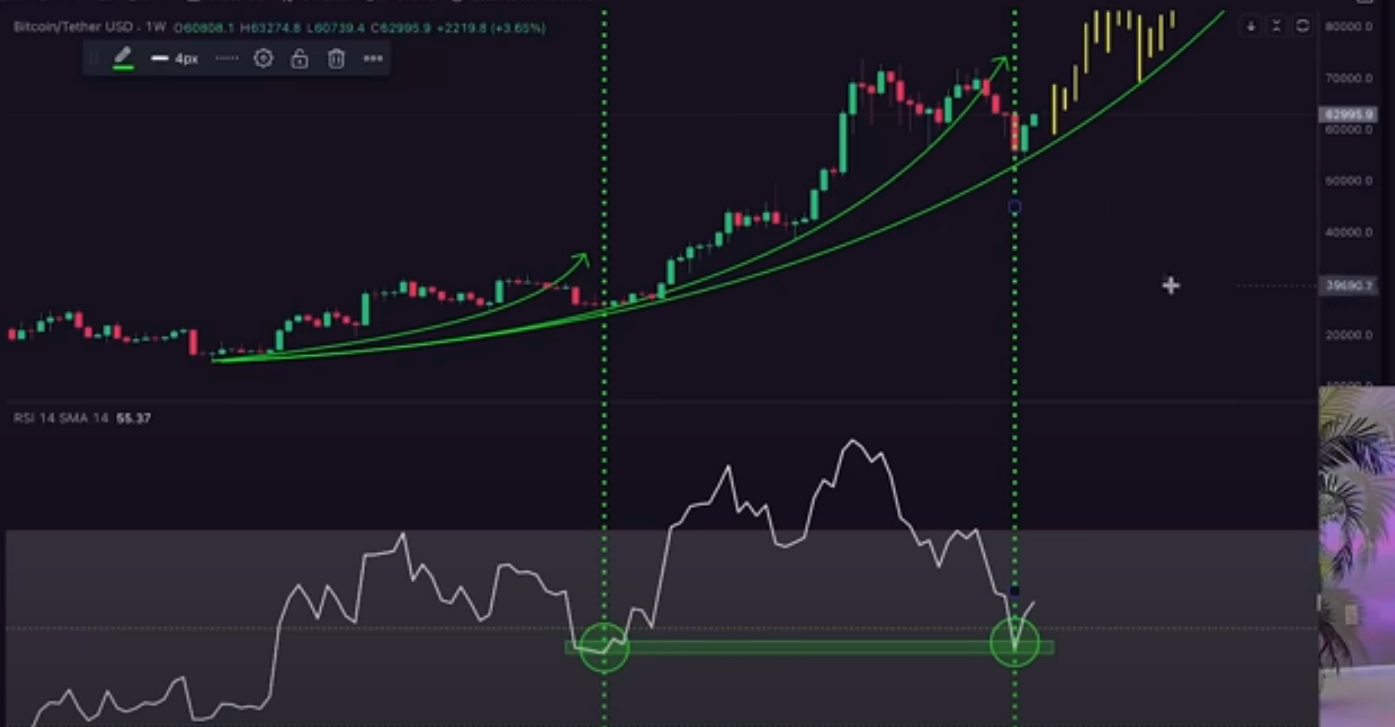
In a new video update, analyst Kevin Svenson tells his 78,700 followers on YouTube that Bitcoin appears to be mirroring its 2017 price action when BTC witnessed three parabolic phases before ending its bull market.
“In 2017, there were multiple phases of the parabolic trend where you have a shorter-term parabolic trend that would then break down into a larger one and then it would it again – break down into a larger trend. Then eventually, you had a major, major vertical run toward the end.
Right now in 2024, we’re sitting in the same position. There’s no reason why this couldn’t happen. What we need is just a renewed sense of optimism, and we need to regain momentum.”

According to Svenson, technical indicators are suggesting that momentum is starting to swing to the side of BTC bulls.
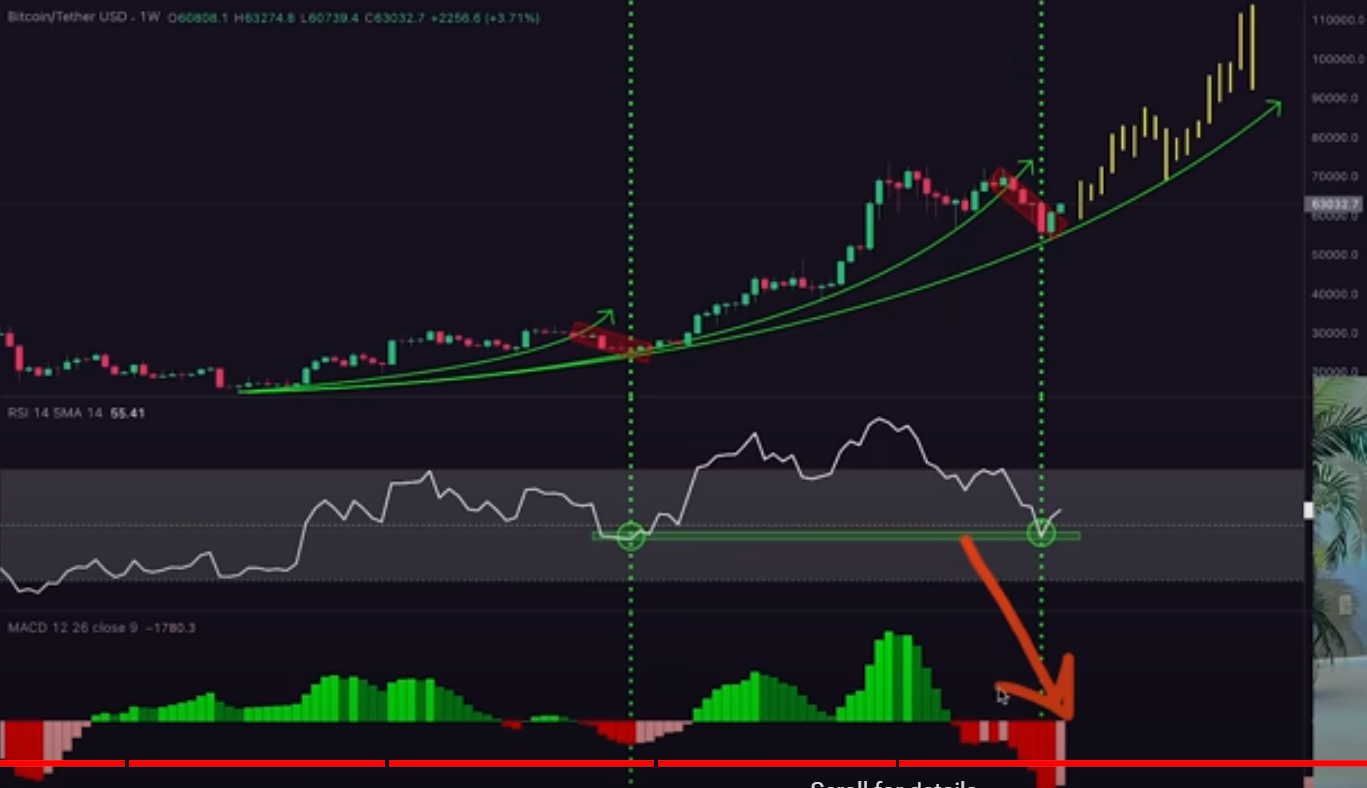
Looking at Bitcoin’s relative strength index (RSI), a momentum indicator, Svenson says the indicator found support at a level when BTC began the second parabolic phase of this cycle.
“If you look at the beginning of 2023 when we had that initial part of the parabola with a breakdown, we found support right around the 45 level on the weekly RSI, and we just bounced off that level again…
So this could just be a zone of expansion of the trend. ”

Svenson also says that Bitcoin’s moving average convergence divergence (MACD), a trend indicator, suggests that BTC bulls are regaining control of the market.
“The weekly MACD right now is starting to show that bearish momentum is decreasing, that bullish momentum is starting to pick up. If that is the case, when we have these weekly MACD histogram turnarounds, that’s normally where the price is getting tremendous speed.”

At time of writing, Bitcoin is trading for $65,469, up about 15% in the last seven days.
Generated Image: Midjourney
A closely followed crypto strategist believes that Bitcoin (BTC) is gearing up to witness its third parabolic run this cycle.
In a new video update, analyst Kevin Svenson tells his 78,700 followers on YouTube that Bitcoin appears to be mirroring its 2017 price action when BTC witnessed three parabolic phases before ending its bull market.
“In 2017, there were multiple phases of the parabolic trend where you have a shorter-term parabolic trend that would then break down into a larger one and then it would it again – break down into a larger trend. Then eventually, you had a major, major vertical run toward the end.
Right now in 2024, we’re sitting in the same position. There’s no reason why this couldn’t happen. What we need is just a renewed sense of optimism, and we need to regain momentum.”

According to Svenson, technical indicators are suggesting that momentum is starting to swing to the side of BTC bulls.
Looking at Bitcoin’s relative strength index (RSI), a momentum indicator, Svenson says the indicator found support at a level when BTC began the second parabolic phase of this cycle.
“If you look at the beginning of 2023 when we had that initial part of the parabola with a breakdown, we found support right around the 45 level on the weekly RSI, and we just bounced off that level again…
So this could just be a zone of expansion of the trend. ”

Svenson also says that Bitcoin’s moving average convergence divergence (MACD), a trend indicator, suggests that BTC bulls are regaining control of the market.
“The weekly MACD right now is starting to show that bearish momentum is decreasing, that bullish momentum is starting to pick up. If that is the case, when we have these weekly MACD histogram turnarounds, that’s normally where the price is getting tremendous speed.”

At time of writing, Bitcoin is trading for $65,469, up about 15% in the last seven days.
Generated Image: Midjourney


