Ethereum maintains its price above $3,400 and appears poised for a significant rally as analyst Ali Martinez predicts an imminent surge.
Over the past 24 hours, Ethereum’s (ETH) price has increased by 2.9% to trade at $3,485 amid a 66% surge in daily trading volume to $9.7 billion.
Analyst Matinez Predicts A surge in ETH Price
The recent rise in Ethereum’s price aligns with analyst Martinez’s observations on X. He notes that the TD Sequential indicator has signaled a buy on Ethereum’s 3-day chart. This tool, which helps pinpoint trend exhaustion and potential price reversals, suggests a bullish turnaround for ETH.
The TD Sequential presents a buy signal on the #Ethereum 3-day chart, predicting a rebound of one to four candlesticks for $ETH! pic.twitter.com/hpCS3SvyiM
— Ali (@ali_charts) June 30, 2024
Martinez predicts that this could lead to a rebound, with one to four candlesticks moving upwards, suggesting that the Ethereum price may continue to rise in the upcoming days.
Recently, Ethereum tried to rally but didn’t have enough bullish momentum to sustain the climb. It couldn’t hold above the $3,700 resistance level and began to decline. The drop went beyond $3,600 and fell below the $3,550 support level, hitting a low of around $3,430.
Now, similar to Bitcoin, Ethereum is showing signs of a breakout that could push its price above $4,100.

Ethereum Price Could Surge on Bullish Technicals
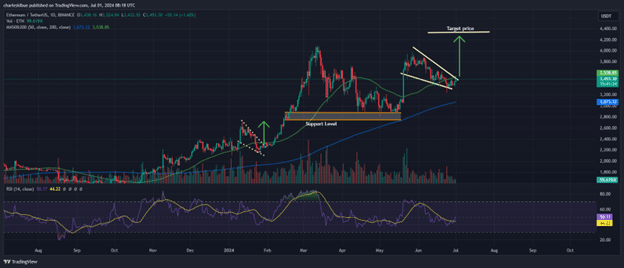
The falling wedge pattern has formed, signaling a potential bullish reversal that could prompt optimistic investors to drive prices higher. Presently, the price is above both the 50-day and 200-day simple moving averages (SMAs), with bulls aiming to break out above the wedge pattern to initiate a rally.
The Relative Strength Index (RSI) shows signs of recovery, hovering around 49, just above the midpoint of 50. This indicates significant buying pressure. A surge in bullish momentum could afford more strength to the bulls, confirming expectations of an impending rally.
Meanwhile, the Moving Average Convergence Divergence (MACD) indicator is bullish. The blue line has crossed above the orange signal line towards neutrality, signaling a shift in momentum from bearish to bullish. Additionally, positive histogram bars indicate momentum in price movement, further supporting the optimistic outlook.
Ethereum Price Further Upside Potential: Possible $4,100 Breakout
Ethereum’s price is at a crucial point, with bulls fighting to maintain upward momentum and target the $4,100 mark. The presence of a falling wedge pattern supports bullish sentiment, with hopes of pushing towards Ethereum’s all-time high of $4,880.
However, if bears capitalize on weakness near the wedge’s upper boundary, they could initiate a downside move toward the $3,450 support level, which is aligned with the wedge’s lower trendline. Traders and investors should closely watch these levels for potential changes in market sentiment and price movements.
Ethereum maintains its price above $3,400 and appears poised for a significant rally as analyst Ali Martinez predicts an imminent surge.
Over the past 24 hours, Ethereum’s (ETH) price has increased by 2.9% to trade at $3,485 amid a 66% surge in daily trading volume to $9.7 billion.
Analyst Matinez Predicts A surge in ETH Price
The recent rise in Ethereum’s price aligns with analyst Martinez’s observations on X. He notes that the TD Sequential indicator has signaled a buy on Ethereum’s 3-day chart. This tool, which helps pinpoint trend exhaustion and potential price reversals, suggests a bullish turnaround for ETH.
The TD Sequential presents a buy signal on the #Ethereum 3-day chart, predicting a rebound of one to four candlesticks for $ETH! pic.twitter.com/hpCS3SvyiM
— Ali (@ali_charts) June 30, 2024
Martinez predicts that this could lead to a rebound, with one to four candlesticks moving upwards, suggesting that the Ethereum price may continue to rise in the upcoming days.
Recently, Ethereum tried to rally but didn’t have enough bullish momentum to sustain the climb. It couldn’t hold above the $3,700 resistance level and began to decline. The drop went beyond $3,600 and fell below the $3,550 support level, hitting a low of around $3,430.
Now, similar to Bitcoin, Ethereum is showing signs of a breakout that could push its price above $4,100.

Ethereum Price Could Surge on Bullish Technicals
The falling wedge pattern has formed, signaling a potential bullish reversal that could prompt optimistic investors to drive prices higher. Presently, the price is above both the 50-day and 200-day simple moving averages (SMAs), with bulls aiming to break out above the wedge pattern to initiate a rally.
The Relative Strength Index (RSI) shows signs of recovery, hovering around 49, just above the midpoint of 50. This indicates significant buying pressure. A surge in bullish momentum could afford more strength to the bulls, confirming expectations of an impending rally.
Meanwhile, the Moving Average Convergence Divergence (MACD) indicator is bullish. The blue line has crossed above the orange signal line towards neutrality, signaling a shift in momentum from bearish to bullish. Additionally, positive histogram bars indicate momentum in price movement, further supporting the optimistic outlook.
Ethereum Price Further Upside Potential: Possible $4,100 Breakout
Ethereum’s price is at a crucial point, with bulls fighting to maintain upward momentum and target the $4,100 mark. The presence of a falling wedge pattern supports bullish sentiment, with hopes of pushing towards Ethereum’s all-time high of $4,880.
However, if bears capitalize on weakness near the wedge’s upper boundary, they could initiate a downside move toward the $3,450 support level, which is aligned with the wedge’s lower trendline. Traders and investors should closely watch these levels for potential changes in market sentiment and price movements.


