Crypto analyst Crypto Lalit highlights that Shiba Inu must break the key resistance level above $0.00001765 for a potential breakout, while current market sentiment shows a balanced distribution.
A crypto analyst, Crypto Lalit, has highlighted the importance of Shiba Inu (SHIB) breaking a significant resistance level. According to the analysis, SHIB has been following a downward trendline since early June, consistently testing this resistance without successfully breaking above it.
As of the latest data, Shiba Inu is trading just below this trendline at $0.00001765, showing slight upward movement that suggests a potential breakout attempt.
Let $SHIB break this Trendline will go long in #SHIBUSDT with 10X pic.twitter.com/MYJCLrYrye
— Crypto Lalit (@CryptoLalit151) June 25, 2024
Potential for a Breakout
The analyst suggests that if SHIB breaks above this trendline, it could lead to a significant upward movement. The strategy recommended involves going long on SHIB/USDT with a 10x leverage upon a confirmed breakout.
This approach relies on the common market behavior, where breaking a long-standing resistance often triggers substantial price increases. Currently, SHIB has a price of $0.00001762. Despite a 1.75% price increase in the last 24 hours, Shiba Inu has seen a 6.03% decline over the past week.
Bulls and Bears Analysis
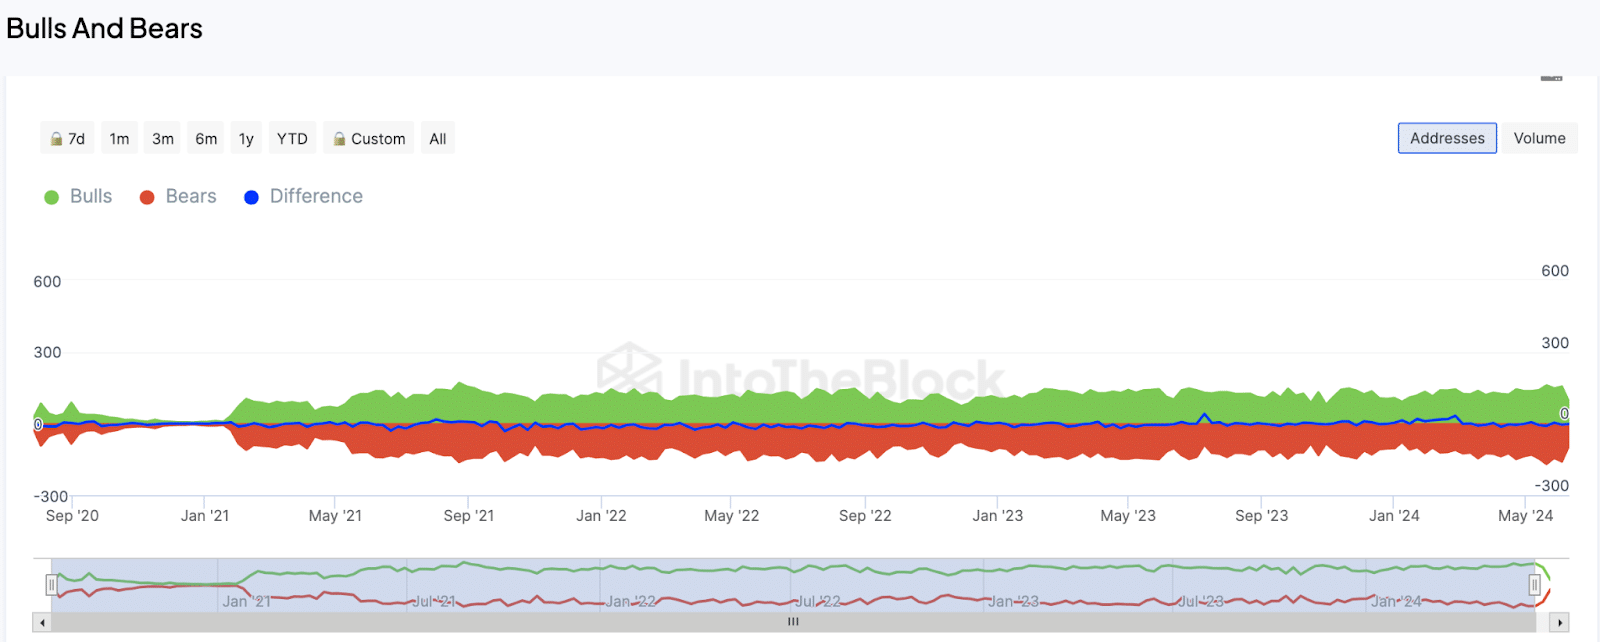
IntoTheBlock data shows a relatively balanced distribution between bulls and bears from September 2020 to May 2024. During the 2021 bull run, there was a notable increase in bullish addresses, indicating a significant number of large addresses purchasing Shiba Inu.

However, post-2021, the chart reveals a rise in bearish addresses as the price corrected. From 2022 to early 2023, the market showed stability with a balanced distribution between bulls and bears, suggesting consolidation. Recent activity in 2023-2024 indicates a slight increase in bearish addresses due to a downturn in SHIB’s price.
Meanwhile, according to Ali Martinez, an on-chain analyst, the TD Sequential indicator has recently flashed buy signals for SHIB in addition to Solana and Cardano on the daily timeframe.
This signal emerged after a market shakeout where most altcoins hit new multi-week lows. For SHIB, this resulted in a bottom at $0.00001642, marking a 38% dip from its June 5 high. The technical indicators suggest that patient investors might find this a prime buying opportunity, anticipating a significant rebound.
Crypto analyst Crypto Lalit highlights that Shiba Inu must break the key resistance level above $0.00001765 for a potential breakout, while current market sentiment shows a balanced distribution.
A crypto analyst, Crypto Lalit, has highlighted the importance of Shiba Inu (SHIB) breaking a significant resistance level. According to the analysis, SHIB has been following a downward trendline since early June, consistently testing this resistance without successfully breaking above it.
As of the latest data, Shiba Inu is trading just below this trendline at $0.00001765, showing slight upward movement that suggests a potential breakout attempt.
Let $SHIB break this Trendline will go long in #SHIBUSDT with 10X pic.twitter.com/MYJCLrYrye
— Crypto Lalit (@CryptoLalit151) June 25, 2024
Potential for a Breakout
The analyst suggests that if SHIB breaks above this trendline, it could lead to a significant upward movement. The strategy recommended involves going long on SHIB/USDT with a 10x leverage upon a confirmed breakout.
This approach relies on the common market behavior, where breaking a long-standing resistance often triggers substantial price increases. Currently, SHIB has a price of $0.00001762. Despite a 1.75% price increase in the last 24 hours, Shiba Inu has seen a 6.03% decline over the past week.
Bulls and Bears Analysis
IntoTheBlock data shows a relatively balanced distribution between bulls and bears from September 2020 to May 2024. During the 2021 bull run, there was a notable increase in bullish addresses, indicating a significant number of large addresses purchasing Shiba Inu.

However, post-2021, the chart reveals a rise in bearish addresses as the price corrected. From 2022 to early 2023, the market showed stability with a balanced distribution between bulls and bears, suggesting consolidation. Recent activity in 2023-2024 indicates a slight increase in bearish addresses due to a downturn in SHIB’s price.
Meanwhile, according to Ali Martinez, an on-chain analyst, the TD Sequential indicator has recently flashed buy signals for SHIB in addition to Solana and Cardano on the daily timeframe.
This signal emerged after a market shakeout where most altcoins hit new multi-week lows. For SHIB, this resulted in a bottom at $0.00001642, marking a 38% dip from its June 5 high. The technical indicators suggest that patient investors might find this a prime buying opportunity, anticipating a significant rebound.


