A closely followed crypto analyst thinks it’s almost time for altcoins to witness the steepest leg of the bull market.
Pseudonymous analyst TechDev tells his 460,100 followers on the social media platform X that the Bitcoin dominance (BTC.D) chart is flashing a massive bearish reversal signal.
The BTC.D index tracks how much of the total crypto market cap belongs to Bitcoin. A bearish BTC.D chart suggests that altcoins are about to outperform Bitcoin.
According to TechDev, BTC.D is showing a bearish divergence on the five-day chart, indicating that Bitcoin is losing momentum against altcoins.
“The building five-day bearish divergence on Bitcoin dominance says it’s ready for its largest plummet in four years.
Those new to this, welcome to the bottom of altcoins’ wave two. They come at BTC all-time high consolidations.
And you hear about ‘What if no altseason?’
Wait until you see wave three.”
TechDev practices Elliott Wave theory, which states that a bullish asset tends to witness a five-wave surge, where waves one, three and five are upside moves and waves two and four are corrective periods. The theory also states that wave three is the longest wave of the rally.
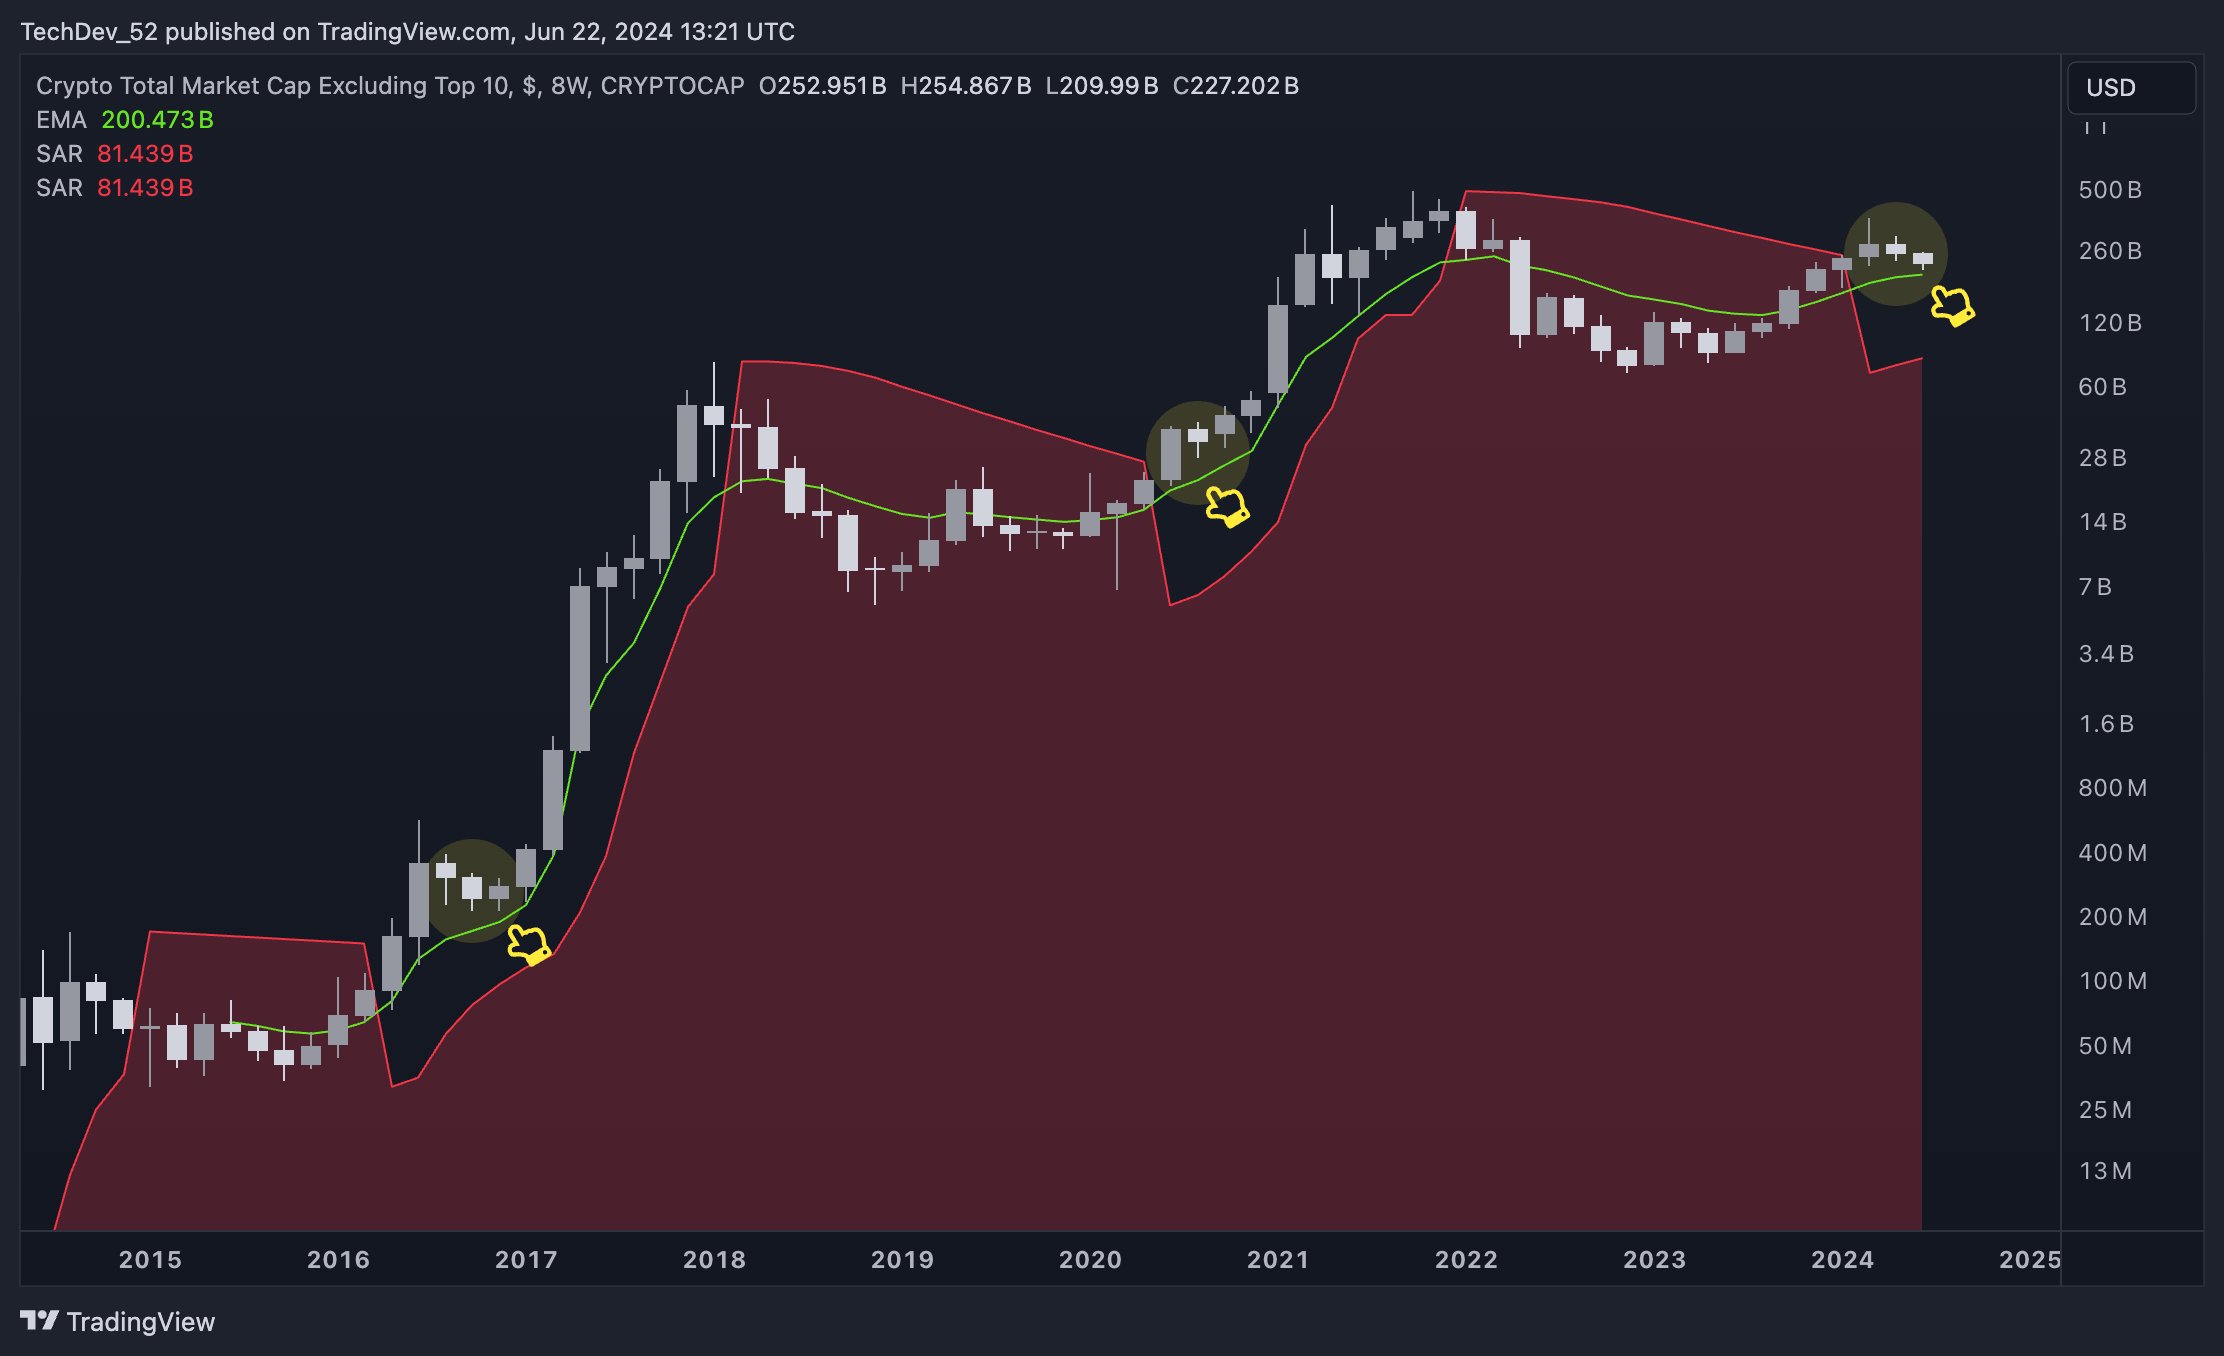
To support his bullish stance on altcoins, the analyst shares an eight-week chart of the OTHERS index, which tracks the market capitalization of all crypto excluding the ten largest digital assets and stablecoins.
According to TechDev’s chart, OTHERS appears to be retesting its exponential moving average (EMA) as support, similar to what happened in the early stages of the 2017 and 2020 bull markets.
“Altcoins.
Think it’s over? So did they.”

Looking at the trader’s chart, it seems that the EMA is hovering at $200 billion. At time of writing, OTHERS is trading at $222.757 billion.
Generated Image: Midjourney
A closely followed crypto analyst thinks it’s almost time for altcoins to witness the steepest leg of the bull market.
Pseudonymous analyst TechDev tells his 460,100 followers on the social media platform X that the Bitcoin dominance (BTC.D) chart is flashing a massive bearish reversal signal.
The BTC.D index tracks how much of the total crypto market cap belongs to Bitcoin. A bearish BTC.D chart suggests that altcoins are about to outperform Bitcoin.
According to TechDev, BTC.D is showing a bearish divergence on the five-day chart, indicating that Bitcoin is losing momentum against altcoins.
“The building five-day bearish divergence on Bitcoin dominance says it’s ready for its largest plummet in four years.
Those new to this, welcome to the bottom of altcoins’ wave two. They come at BTC all-time high consolidations.
And you hear about ‘What if no altseason?’
Wait until you see wave three.”
TechDev practices Elliott Wave theory, which states that a bullish asset tends to witness a five-wave surge, where waves one, three and five are upside moves and waves two and four are corrective periods. The theory also states that wave three is the longest wave of the rally.
To support his bullish stance on altcoins, the analyst shares an eight-week chart of the OTHERS index, which tracks the market capitalization of all crypto excluding the ten largest digital assets and stablecoins.
According to TechDev’s chart, OTHERS appears to be retesting its exponential moving average (EMA) as support, similar to what happened in the early stages of the 2017 and 2020 bull markets.
“Altcoins.
Think it’s over? So did they.”

Looking at the trader’s chart, it seems that the EMA is hovering at $200 billion. At time of writing, OTHERS is trading at $222.757 billion.
Generated Image: Midjourney


