BONK price demonstrates a high-level bullish sentiment today as technical indicators shows an increase of 14.8%. Analysts point to the Elliott Wave pattern and potential breakout targets as positive indications toward further price gains.
BONK Price Chart Analysis
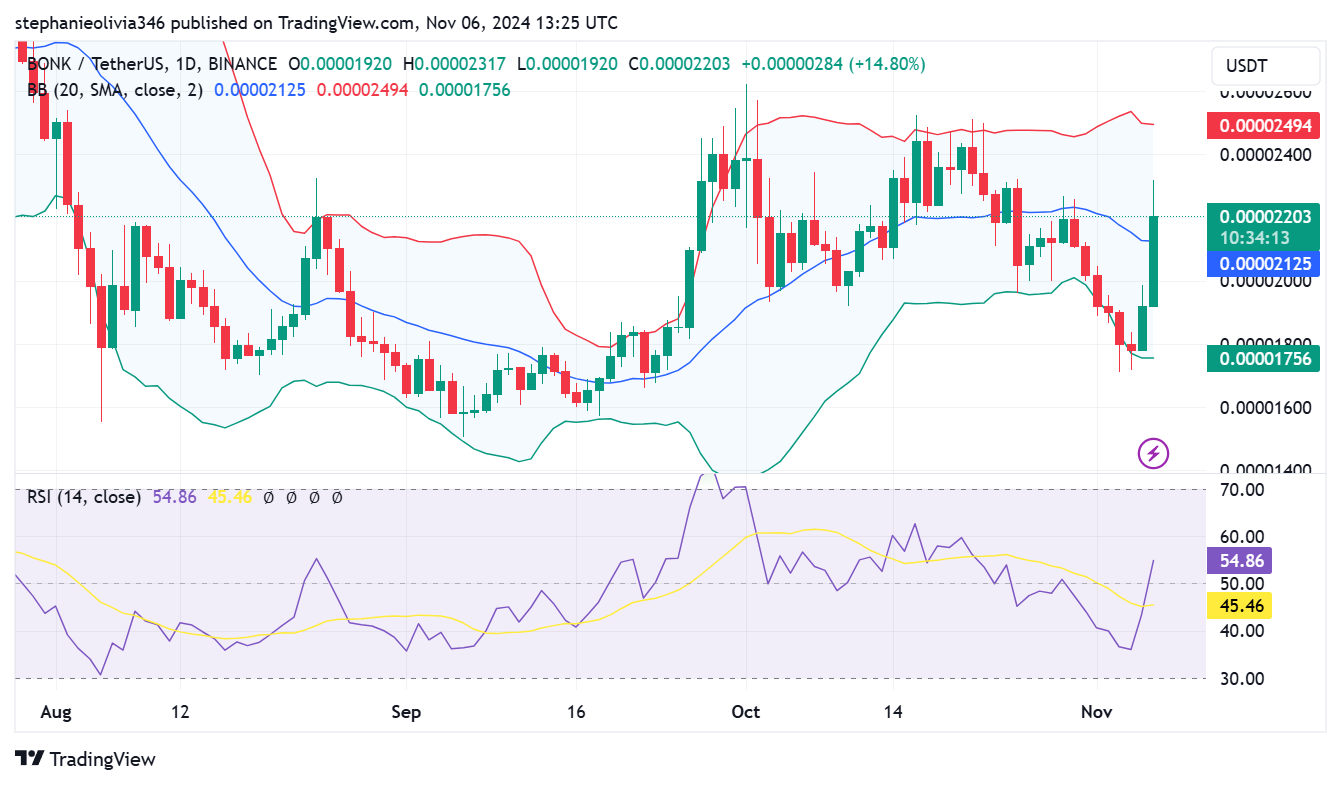
BONK is now trading at $0.00002203 pointing to a new bullish trend. The meme coin is currently situated above the 20-day Simple Moving Average, which signifies a short-term bullish run. If this trend continues, the SMA will act as a support level, ensuring that BONK’s uptrend remains intact.
Immediate resistance is located at the upper Bollinger Band currently set at $0.00002494 which might offer a short-term resistance until the bulls dominate the market. Breaking this level would signal further bullish momentum, possibly attracting more investors.
Bollinger Bands Suggest Increased Volatility in BONK Price
At the current price of $0.00002203, BONK is nearing the upper Bollinger Band which may act as a resistance if the price fails to break above the upper Bollinger Band at $0.00002494.
However, should the price drop back, the middle Bollinger Band at $0.0002125 may serve as a key support level to hold if the Bulls are to retreat for a moment.
The lower Bollinger Band is the stronger support at $0.00001756 if BONK is to experience a more significant dip within the recently seen price range. These bands indicate that although the present trend is bullish, the trader should look for a breakout or a consolidation around these levels.
RSI Indicates Moderate Bullish Momentum
The Relative Strength Index (RSI) is 54.86, indicating moderate buying pressure without crossing the overbought level, which is above 70.

RSI remains within the bounds that signal more room for upward movement, with no indications of a reversal in the short term. Furthermore, if the RSI indicator continues to rise towards 60 or above, it will provide a solid and positive signal for the bulls in BONK.
BONK Price: Possible Formation of a Bullish Wave
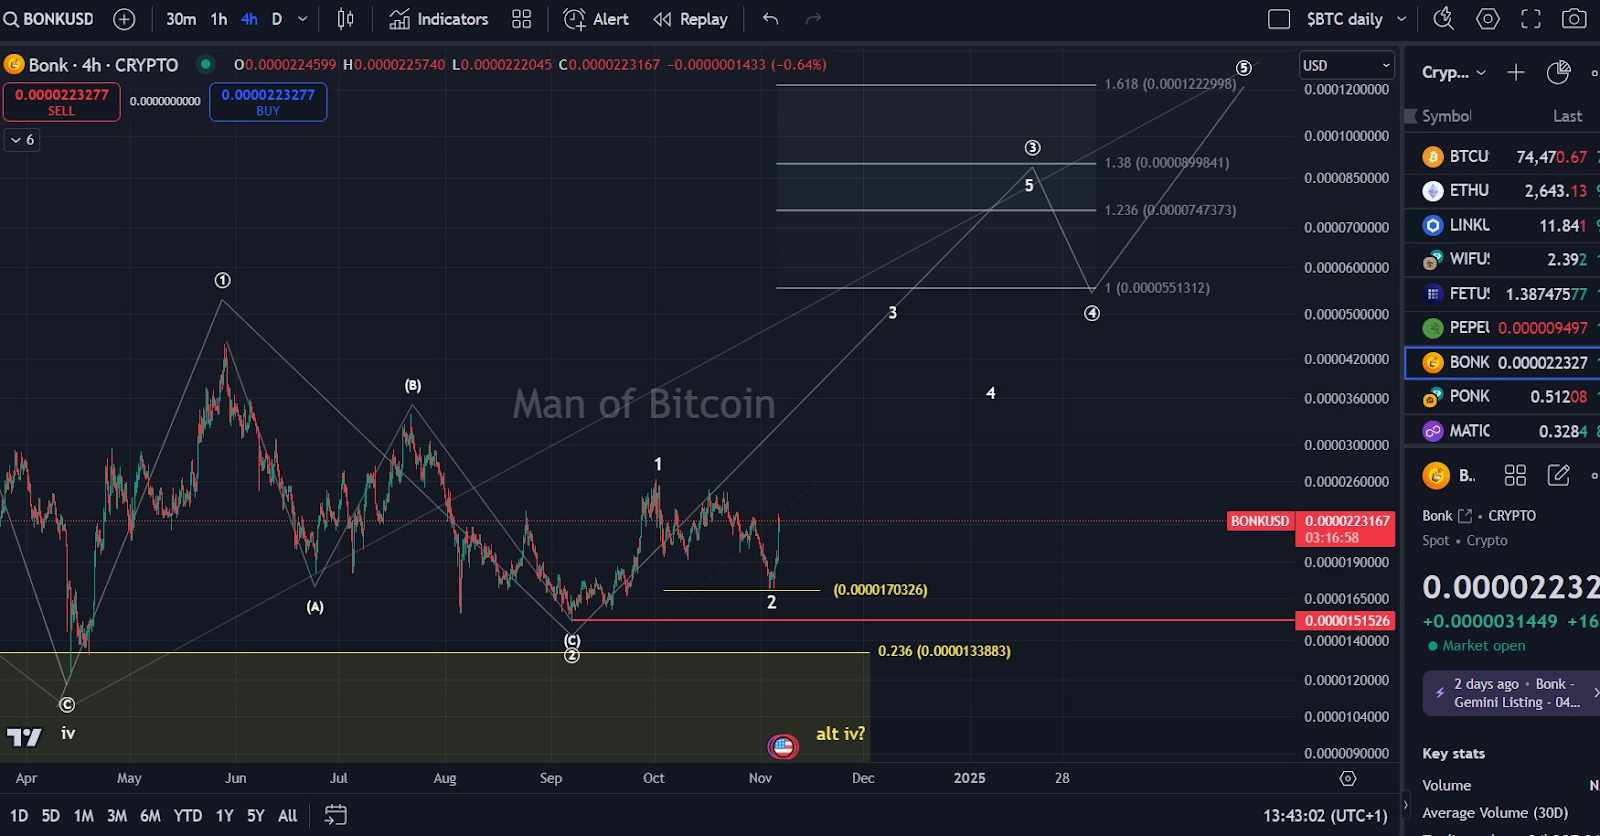
Analyst ManofBitcoin stated that BONK is likely experiencing an early-stage bullish Elliott wave, with a bottom possibility at wave-2.
$BONK price has likely formed a low in wave-2. A break above $0.0000262 is the first objective for the bulls.
Target for circled wave-3 is the $0.0000899 price level. pic.twitter.com/LUiZKWI5Jh— Man of Bitcoin (@Manofbitcoin) November 6, 2024
Nevertheless, further clear movements above $0.0000262 signal a shift into wave-3 which is significant in relation to a stronger bullish run. Any breakout above this level would lead to a more bullish trend, hence attracting more buying pressure.

The target for circled wave-3 is $0.0000899, a level arrived at by using the 1.618 Fibonacci extension as suggested by the Elliott Wave theory of trading, where there is a typical resistance level.
Overall Market Condition and Analyst Views
The meme coin declined by 15% trading at $0.0000174 before recording a 32.2% recovery, which may suggest the potential for bullish pressure.
According to analysts, a daily close above $0.0000227 would be key to breaking BONK’s current bearish market structure and confirming a trend reversal.
Several analysts are convinced that a sustained Bitcoin rally might post a positive effect on BONK’s revival, thus strengthening the buying pressure. If Bitcoin keeps on moving upwards, it will provide more bullish outlooks for BONK as well as other cryptocurrencies.
BONK price demonstrates a high-level bullish sentiment today as technical indicators shows an increase of 14.8%. Analysts point to the Elliott Wave pattern and potential breakout targets as positive indications toward further price gains.
BONK Price Chart Analysis
BONK is now trading at $0.00002203 pointing to a new bullish trend. The meme coin is currently situated above the 20-day Simple Moving Average, which signifies a short-term bullish run. If this trend continues, the SMA will act as a support level, ensuring that BONK’s uptrend remains intact.
Immediate resistance is located at the upper Bollinger Band currently set at $0.00002494 which might offer a short-term resistance until the bulls dominate the market. Breaking this level would signal further bullish momentum, possibly attracting more investors.
Bollinger Bands Suggest Increased Volatility in BONK Price
At the current price of $0.00002203, BONK is nearing the upper Bollinger Band which may act as a resistance if the price fails to break above the upper Bollinger Band at $0.00002494.
However, should the price drop back, the middle Bollinger Band at $0.0002125 may serve as a key support level to hold if the Bulls are to retreat for a moment.
The lower Bollinger Band is the stronger support at $0.00001756 if BONK is to experience a more significant dip within the recently seen price range. These bands indicate that although the present trend is bullish, the trader should look for a breakout or a consolidation around these levels.
RSI Indicates Moderate Bullish Momentum
The Relative Strength Index (RSI) is 54.86, indicating moderate buying pressure without crossing the overbought level, which is above 70.

RSI remains within the bounds that signal more room for upward movement, with no indications of a reversal in the short term. Furthermore, if the RSI indicator continues to rise towards 60 or above, it will provide a solid and positive signal for the bulls in BONK.
BONK Price: Possible Formation of a Bullish Wave
Analyst ManofBitcoin stated that BONK is likely experiencing an early-stage bullish Elliott wave, with a bottom possibility at wave-2.
$BONK price has likely formed a low in wave-2. A break above $0.0000262 is the first objective for the bulls.
Target for circled wave-3 is the $0.0000899 price level. pic.twitter.com/LUiZKWI5Jh— Man of Bitcoin (@Manofbitcoin) November 6, 2024
Nevertheless, further clear movements above $0.0000262 signal a shift into wave-3 which is significant in relation to a stronger bullish run. Any breakout above this level would lead to a more bullish trend, hence attracting more buying pressure.

The target for circled wave-3 is $0.0000899, a level arrived at by using the 1.618 Fibonacci extension as suggested by the Elliott Wave theory of trading, where there is a typical resistance level.
Overall Market Condition and Analyst Views
The meme coin declined by 15% trading at $0.0000174 before recording a 32.2% recovery, which may suggest the potential for bullish pressure.
According to analysts, a daily close above $0.0000227 would be key to breaking BONK’s current bearish market structure and confirming a trend reversal.
Several analysts are convinced that a sustained Bitcoin rally might post a positive effect on BONK’s revival, thus strengthening the buying pressure. If Bitcoin keeps on moving upwards, it will provide more bullish outlooks for BONK as well as other cryptocurrencies.


