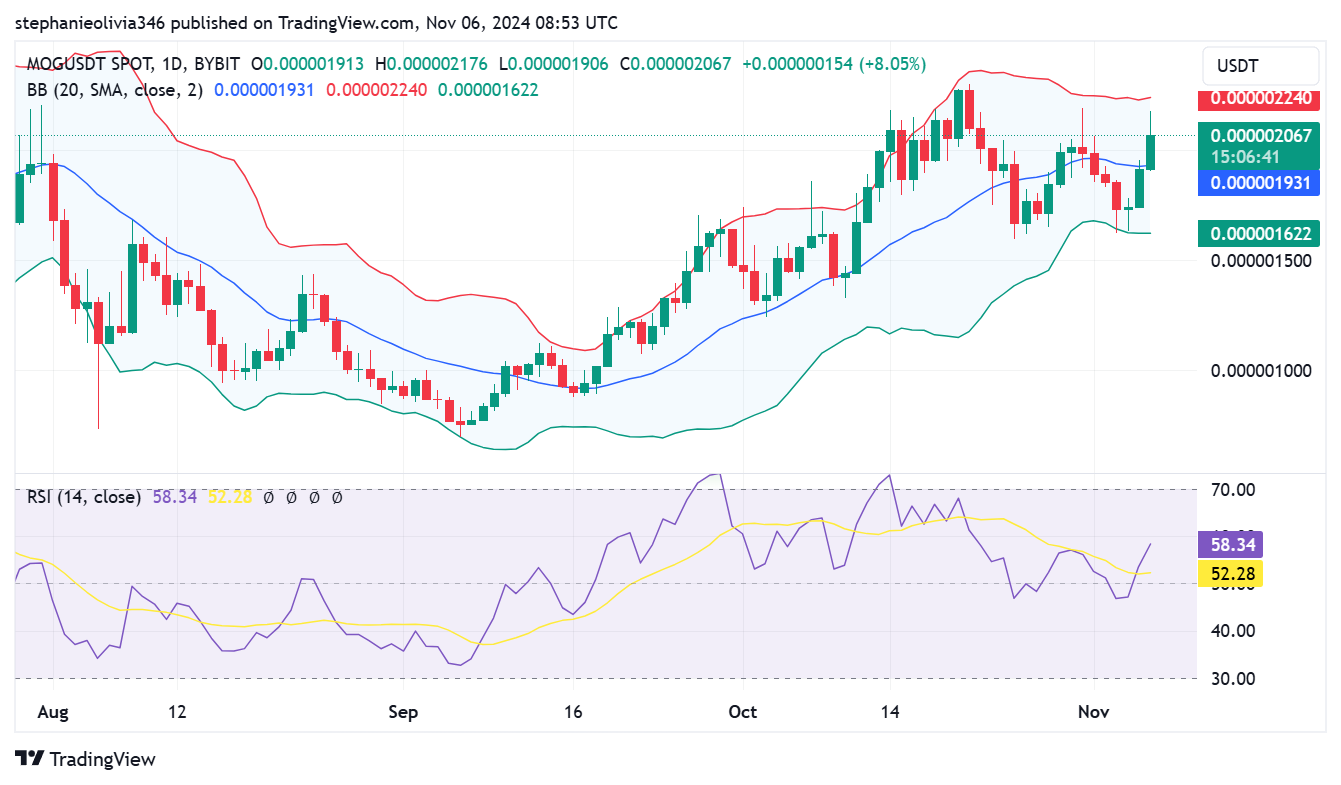
In recent days, MOG (MOG/USDT) has gained much attention from its users. The meme coin has risen by 8.05% over the last 24 hours and now trades at around $0.000002067.
MOG’s bullish momentum is driven by rising demand. As well as favorable indicators which place it above the 20-day Simple Moving Average (SMA).
Market observers are watching to see if MOG can break the upper Bollinger Band and continue with the uptrend as resistance nears.
Strong Bullish Momentum and Key Resistance Levels
Having risen in price over the last couple of days, MOG has approached its upper Bollinger Band. This happened at a price of $0.000002240. This resistance level could act as a short-term cap unless more buying pressure continues to be built up.
At the moment, buyers are in control of the market as it trades above the 20-day SMA of $0.000001931, signaling a short-term uptrend.
Nevertheless, such proximity to the upper limit of the Bollinger Band can also indicate strong volatility, and, accordingly, the price may resume to immediate support levels in case of a failed breakout.
The middle band of the Bollinger Band aligns with the 20-day SMA. It serves as a support zone that could stabilize the price in case MOG fails to overcome the resistance on $0.000002240. Furthermore, if the broader market corrects, MOG offers deeper support in a possible trading range around the lower Bollinger Band of $0.000001622.
Analysts add that if MOG continues the upward momentum and can break above the upper band it could lead to further buying. The same can propel MOG price to new highs.
RSI Shows Room for Upside, Indicating Further Potential
MOG Relative Strength Index is 58.34. This is yet another positive signal, but it hasn’t entered overbought as yet, which generally occurs near 70.

However, this reading also suggests that there is still room for more price gains before the market could see some reversals.
When the RSI touches 70, that can signal conditions are overbought, and they might pull in to consolidate or even have a minor pullback as traders take some profits. The steady rise of RSI shows MooG’s bullish trend and means buyers are still in control.
Analysts Views on MOG Price Potential and Market Sentiment
Crypto analyst Danail534 noted that MOG has seen a recent surge upward and could see even more gains, provided that Bitcoin remains strong.
According to Danail534, MOG’s price action has been positively influenced by Bitcoin’s robust performance, along with trends in other popular assets like DEGEN and COQ.

This broader market momentum is expected to play a critical role in supporting MOG’s ongoing price trajectory.
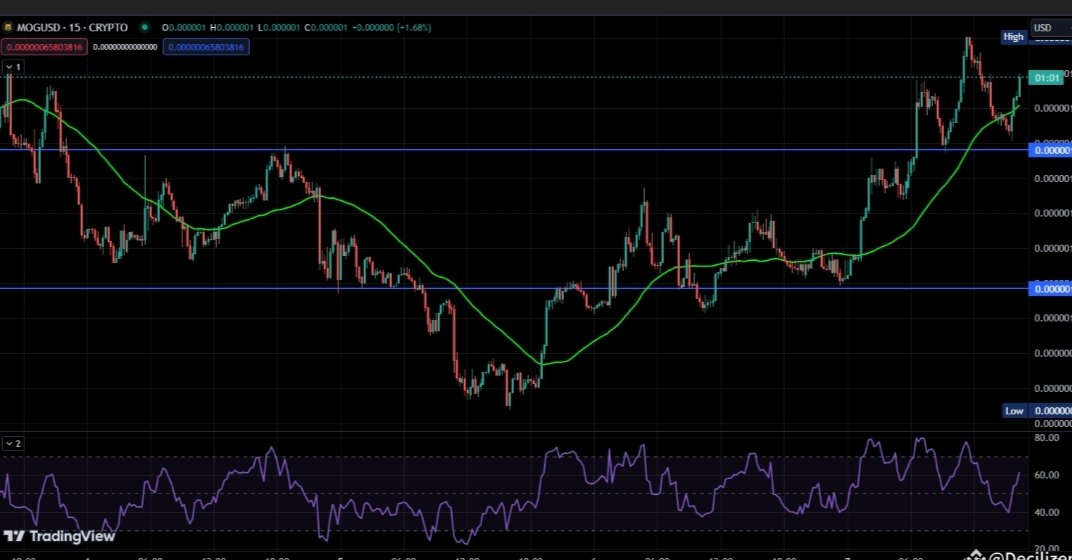
Danail534’s analysis also highlights clear support and resistance levels within the MOG/USDT chart, marked by horizontal lines. The lower blue line shows resilience as support, potentially providing a solid base if the market turns bearish.
In recent days, MOG (MOG/USDT) has gained much attention from its users. The meme coin has risen by 8.05% over the last 24 hours and now trades at around $0.000002067.
MOG’s bullish momentum is driven by rising demand. As well as favorable indicators which place it above the 20-day Simple Moving Average (SMA).
Market observers are watching to see if MOG can break the upper Bollinger Band and continue with the uptrend as resistance nears.
Strong Bullish Momentum and Key Resistance Levels
Having risen in price over the last couple of days, MOG has approached its upper Bollinger Band. This happened at a price of $0.000002240. This resistance level could act as a short-term cap unless more buying pressure continues to be built up.
At the moment, buyers are in control of the market as it trades above the 20-day SMA of $0.000001931, signaling a short-term uptrend.
Nevertheless, such proximity to the upper limit of the Bollinger Band can also indicate strong volatility, and, accordingly, the price may resume to immediate support levels in case of a failed breakout.
The middle band of the Bollinger Band aligns with the 20-day SMA. It serves as a support zone that could stabilize the price in case MOG fails to overcome the resistance on $0.000002240. Furthermore, if the broader market corrects, MOG offers deeper support in a possible trading range around the lower Bollinger Band of $0.000001622.
Analysts add that if MOG continues the upward momentum and can break above the upper band it could lead to further buying. The same can propel MOG price to new highs.
RSI Shows Room for Upside, Indicating Further Potential
MOG Relative Strength Index is 58.34. This is yet another positive signal, but it hasn’t entered overbought as yet, which generally occurs near 70.

However, this reading also suggests that there is still room for more price gains before the market could see some reversals.
When the RSI touches 70, that can signal conditions are overbought, and they might pull in to consolidate or even have a minor pullback as traders take some profits. The steady rise of RSI shows MooG’s bullish trend and means buyers are still in control.
Analysts Views on MOG Price Potential and Market Sentiment
Crypto analyst Danail534 noted that MOG has seen a recent surge upward and could see even more gains, provided that Bitcoin remains strong.
According to Danail534, MOG’s price action has been positively influenced by Bitcoin’s robust performance, along with trends in other popular assets like DEGEN and COQ.

This broader market momentum is expected to play a critical role in supporting MOG’s ongoing price trajectory.
Danail534’s analysis also highlights clear support and resistance levels within the MOG/USDT chart, marked by horizontal lines. The lower blue line shows resilience as support, potentially providing a solid base if the market turns bearish.


