- XRP has been relisted across several crypto exchanges since Judge Torres’s ruling in August.
- The US Presidential election on Tuesday may be the deciding factor in the battle between Ripple and the Gensler administration.
- XRP could see a 10% rally if it breaks above the upper boundary of a symmetrical triangle.
Ripple’s XRP is trading at $0.5050 up slightly by 0.2% in the past 24 hours as it struggles to sustain a move above a key symmetry triangle resistance. Meanwhile, in its recently released Q3 report, Ripple noted the rising listing and relisting of XRP across crypto exchanges and global platforms.
Ripple’s Q3 report highlights XRP key milestone
In its recently released Q3 report, Ripple noted that global platforms have increased their listing of XRP while other crypto exchanges that delisted it due to the Securities & Exchange Commission’s (SEC) battle with the firm have relisted the token.
The clarity from its battle with the SEC has also prompted institutional interest in the token, with three asset managers, including Bitwise, Canary and 21Shares, submit filings for an XRP ETF.
Judge Analisa Torres concluded the Ripple vs. SEC case by ordering the firm to pay a $125 million fine, which was far lower than the $2 billion the regulator requested. Judge Torres had earlier ruled that the sale of XRP on exchanges does not violate securities laws. However, the SEC appealed key parts of the Judge’s ruling, and Ripple immediately filed a cross-appeal.
Meanwhile, with the US presidential elections less than 24 hours away, many crypto community members have expressed views that a pro-crypto government may see a new SEC administration which could lead to the termination of its appeal against Ripple.
Ripple technical analysis: XRP could rally by 10% if it breaks above upper triangle limit
Ripple’s XRP is trading close to the $0.5000 psychological level following a 0.2% rise in the past 24 hours.
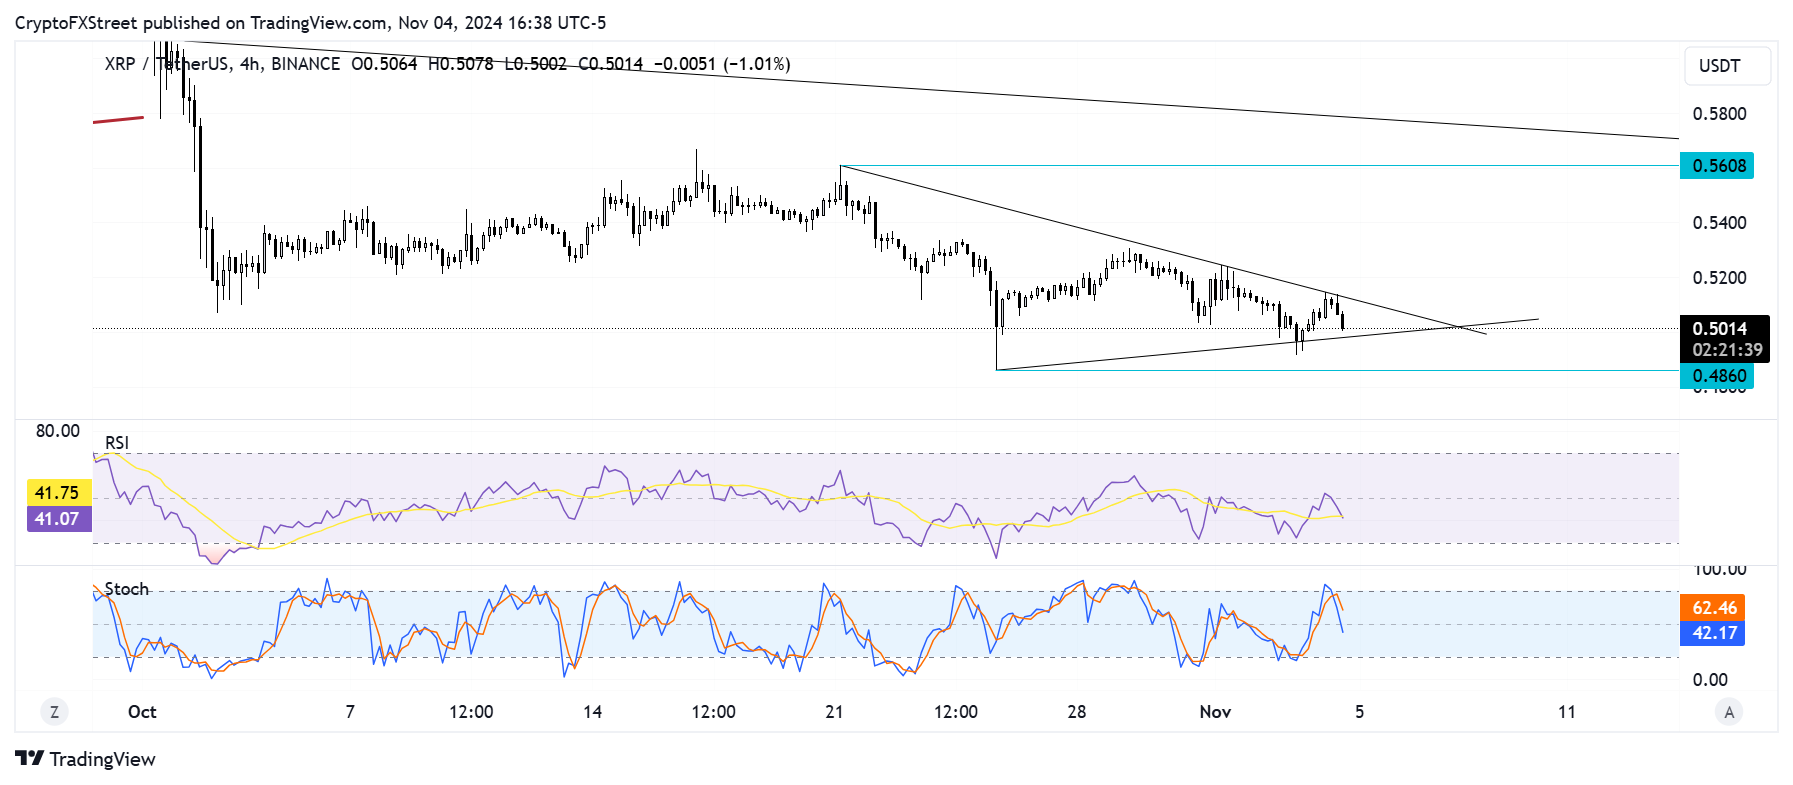
XRP saw a rejection after testing the upper descending trendline of a symmetry triangle extending from October 21. If XRP sustains a daily candlestick close above this trendline, it could rally by nearly 10% to $0.5608.

XRP/USDT 4-hour chart
However, if XRP maintains the decline from its rejection near this upper descending trendline, it could decline and retest the symmetry triangle’s ascending lower trendline support level. A move below this lower trendline could see XRP decline nearly 5% to $0.4860.
The Relative Strength Index (RSI) and the Stochastic Oscillator are testing their respective midline and oversold region lines, indicating that a potential mild pullback is on the horizon.
A daily candlestick close below $0.4860 will invalidate the thesis.


