Avalanche (AVAX) is currently trading near a critical support level of $24. Technical indicators show bearish momentum and potential signs of a reversal.
The asset has been oscillating around this price. Analysts expect a break above $28 that could trigger more buying pressure
Despite its high volatility, crypto analysts believe that if it can break through the $28 level, AVAX could shoot up to $40 in the short term.
AVAX Technical Analysis Highlights Bearish Trend
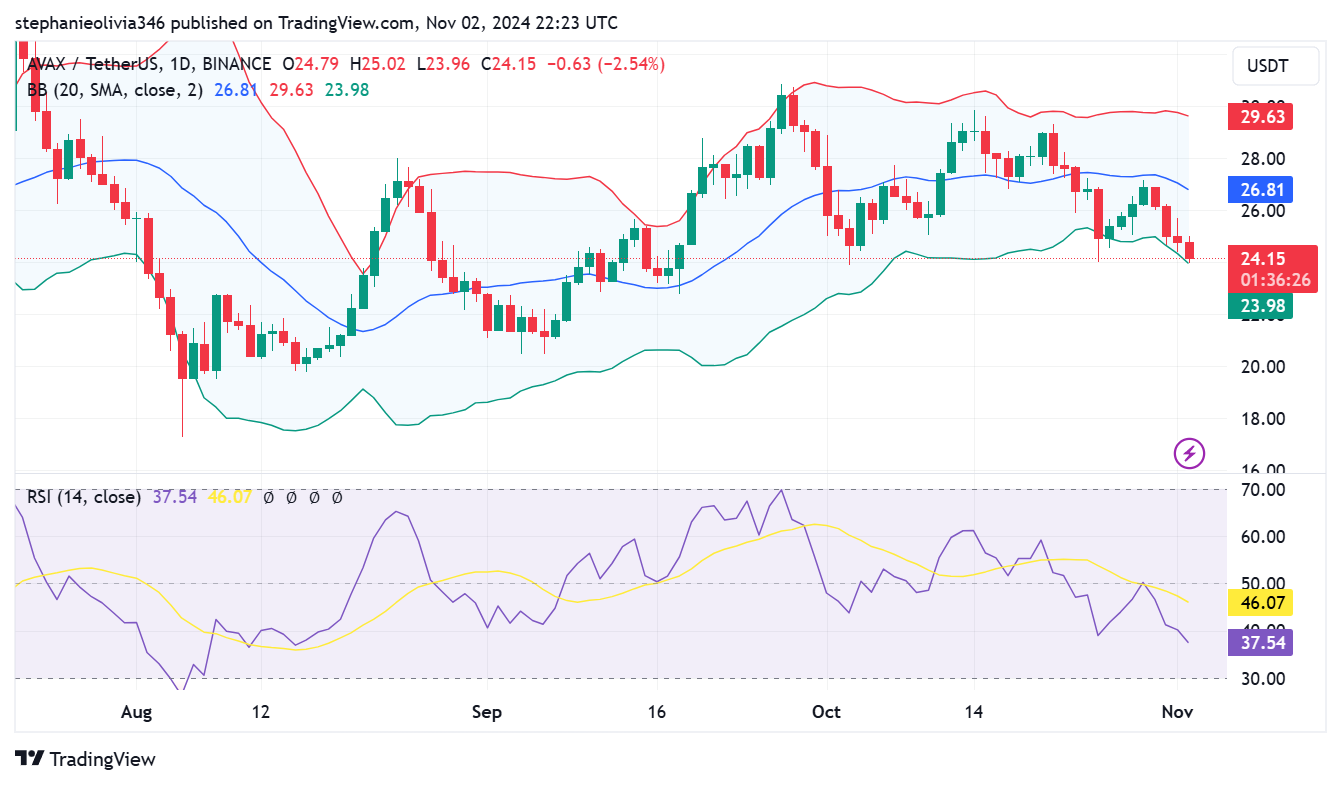
AVAX is still in a bearish trend, its price action is below the 20-day SMA at 26.81. As for its price, AVAX is trading at $24.15.
It is approaching the oversold region near the lower Bollinger bands at 23.98, suggesting bearish pressure. A break above the 20-day SMA could be a bullish signal. But this will require confirmation to sustain the upward movement.

The Relative Strength Index at the moment is 37.54. It is a level that indicates weak bearish momentum and is close to the oversold level, generally below 30.
If it moves upwards above the 50-level for the RSI, this could point towards a positive trend again. Currently, the coin has support and resistance levels at the 20-day SMA ($26.81) and at the upper Bollinger Band ($29.63), which may hinder any upward price movement.
Analyst Highlights Consolidation and Possible Breakout Scenarios
An analyst who goes by the name Ak47 on X (twitter) opined that the consolidation of AVAX near $24 may be preparing for the next upward movement.
$28 is the key resistance level. The price going over it poses a prospect for an increase, giving way to possibly aiming at $40 in the short term.
He goes further to point out the fact that $40 has previously been attained before. This supports the $40 price level as a reasonable take-profit level.
On the chart, the analyst outlines that the formation of a descending triangle pattern is evident. A break to the upside signals a trend reversal.
If AVAX sustains above $24 and shows bullish tendencies, the bullish break of this pattern could push the prices toward Ak47’s target. However, should the price fail to break the $28 resistance, there is potential for further consolidation or even a breakdown of the $24 level.
Traders and analysts should remain attentive to volume spikes and RSI shifts. This could signal the direction of AVAX’s next significant move.
Avalanche (AVAX) is currently trading near a critical support level of $24. Technical indicators show bearish momentum and potential signs of a reversal.
The asset has been oscillating around this price. Analysts expect a break above $28 that could trigger more buying pressure
Despite its high volatility, crypto analysts believe that if it can break through the $28 level, AVAX could shoot up to $40 in the short term.
AVAX Technical Analysis Highlights Bearish Trend
AVAX is still in a bearish trend, its price action is below the 20-day SMA at 26.81. As for its price, AVAX is trading at $24.15.
It is approaching the oversold region near the lower Bollinger bands at 23.98, suggesting bearish pressure. A break above the 20-day SMA could be a bullish signal. But this will require confirmation to sustain the upward movement.

The Relative Strength Index at the moment is 37.54. It is a level that indicates weak bearish momentum and is close to the oversold level, generally below 30.
If it moves upwards above the 50-level for the RSI, this could point towards a positive trend again. Currently, the coin has support and resistance levels at the 20-day SMA ($26.81) and at the upper Bollinger Band ($29.63), which may hinder any upward price movement.
Analyst Highlights Consolidation and Possible Breakout Scenarios
An analyst who goes by the name Ak47 on X (twitter) opined that the consolidation of AVAX near $24 may be preparing for the next upward movement.
$28 is the key resistance level. The price going over it poses a prospect for an increase, giving way to possibly aiming at $40 in the short term.
He goes further to point out the fact that $40 has previously been attained before. This supports the $40 price level as a reasonable take-profit level.
On the chart, the analyst outlines that the formation of a descending triangle pattern is evident. A break to the upside signals a trend reversal.
If AVAX sustains above $24 and shows bullish tendencies, the bullish break of this pattern could push the prices toward Ak47’s target. However, should the price fail to break the $28 resistance, there is potential for further consolidation or even a breakdown of the $24 level.
Traders and analysts should remain attentive to volume spikes and RSI shifts. This could signal the direction of AVAX’s next significant move.


