On-chain movements for ChainLink look bearish as the asset dips again. Some investors are trying to either take profits or offset losses.
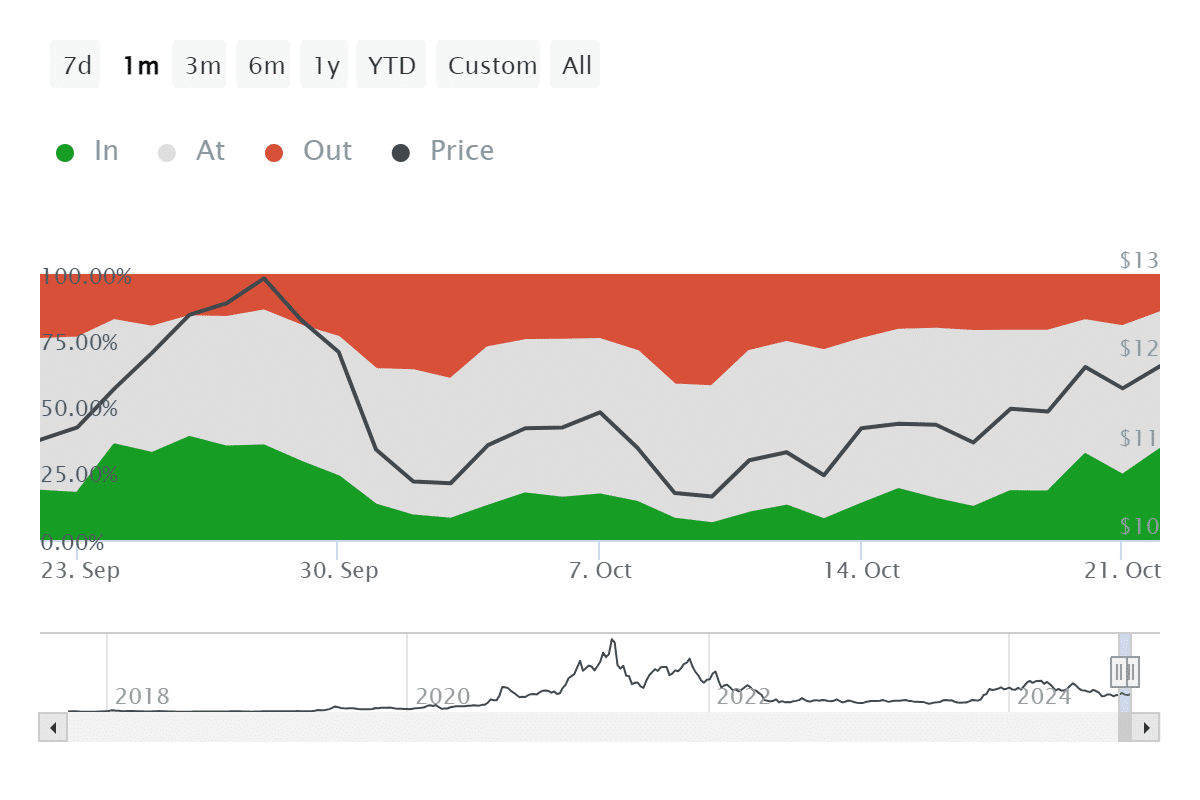
ChainLink (LINK) recorded a bullish September while the border crypto market wandered in the bearish zone. It surged from $9 to $13 within the last three weeks of the month and started October with a sharp fall to the $10 mark.
As LINK tried to recover over the past two weeks, on-chain indicators signal a potential downfall.
According to data provided by IntoTheBlock, the number of ChainLink daily active addresses in profit rose from 155 to 600 over the past week as the asset surpassed the $12 mark.

A surge in the asset’s DAA in profit would hint that some investors want to take profits amid high price volatility.
Despite the price surge, the number of DAA in loss also surged from 222 on Oct. 20 to 263 on Oct. 22. This movement could show that some of the long-term holders might be offsetting their losses.
In both cases, LINK’s bullish momentum could likely face a selloff.
It’s important to note that any market-wide bullish momentum could potentially take ChainLink with it.
Per data from ITB, whale transactions consisting of at least $100,000 worth of LINK rose from 54 on Oct. 19 to 134 on Oct. 22. The total amount of these transactions reached $361 million over the past week.
LINK declined by 1.75% in the past 24 hours and is trading at $11.78 at the time of writing. The asset’s market cap is currently sitting at $7.38 billion with a daily trading volume of $320 million.
The increasing trading volume and the high amount of whale transactions usually bring high price volatility.
On-chain movements for ChainLink look bearish as the asset dips again. Some investors are trying to either take profits or offset losses.
ChainLink (LINK) recorded a bullish September while the border crypto market wandered in the bearish zone. It surged from $9 to $13 within the last three weeks of the month and started October with a sharp fall to the $10 mark.
As LINK tried to recover over the past two weeks, on-chain indicators signal a potential downfall.
According to data provided by IntoTheBlock, the number of ChainLink daily active addresses in profit rose from 155 to 600 over the past week as the asset surpassed the $12 mark.

A surge in the asset’s DAA in profit would hint that some investors want to take profits amid high price volatility.
Despite the price surge, the number of DAA in loss also surged from 222 on Oct. 20 to 263 on Oct. 22. This movement could show that some of the long-term holders might be offsetting their losses.
In both cases, LINK’s bullish momentum could likely face a selloff.
It’s important to note that any market-wide bullish momentum could potentially take ChainLink with it.
Per data from ITB, whale transactions consisting of at least $100,000 worth of LINK rose from 54 on Oct. 19 to 134 on Oct. 22. The total amount of these transactions reached $361 million over the past week.
LINK declined by 1.75% in the past 24 hours and is trading at $11.78 at the time of writing. The asset’s market cap is currently sitting at $7.38 billion with a daily trading volume of $320 million.
The increasing trading volume and the high amount of whale transactions usually bring high price volatility.


