Bitcoin (BTC) has recently retraced after breaking through the psychological $100,000 barrier, falling to a low of $96,000 and triggering over $1.6 billion in liquidations in the past 24 hours.
Despite the correction, analysts remain optimistic about Bitcoin’s long-term outlook, with projections pointing toward a potential peak of $400,000 by 2026.
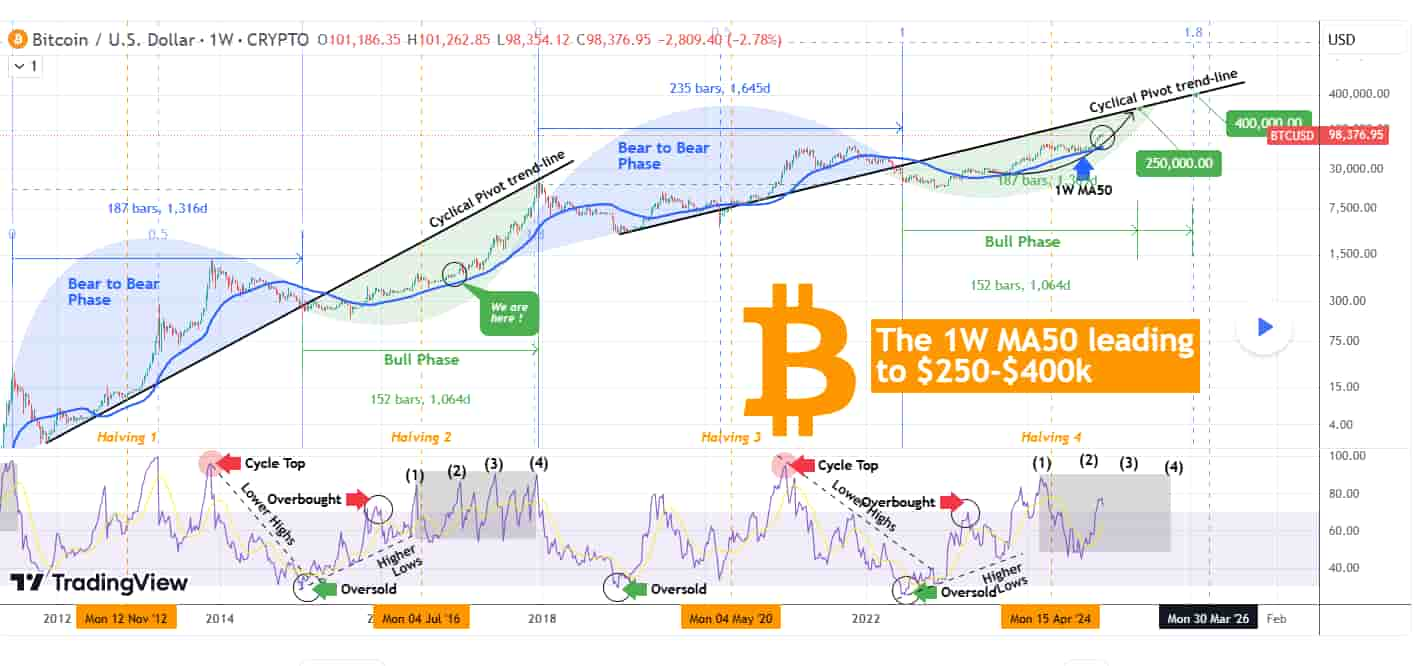
Notably, TradingShot, in an analysis on TradingView, highlighted that Bitcoin’s bullish cycle remains intact, supported by historical patterns and key technical indicators.
50-week moving average: A critical foundation for the bull run
According to the analysis, Bitcoin has managed to maintain its broader bullish structure, defined by a green arc pattern that has shaped its trajectory for over a year.
This pattern continues to hold, with BTC trading consistently below the Cyclical Pivot trend line, which originated from the bottom of the 2018 bear market.

One of the most significant indicators supporting this optimistic outlook is the 50-week moving average (1W MA50). Historically, this trend line has consistently acted as a strong support level during Bitcoin’s bull cycles, holding firm until the market transitions to a bearish phase.
In August, Bitcoin successfully bounced off the 1W MA50 twice during a period of market turbulence, reaffirming its role as a critical level for sustaining upward momentum.
TradingShot emphasizes that as long as Bitcoin holds above this trend line, the bullish structure of the cycle remains intact.
Moreover, Bitcoin’s historical price movements reveal a cyclical symmetry, where the duration of the pre-halving phase often mirrors the post-halving bull cycle.
If this pattern holds, Bitcoin could peak between December 2025 and January 2026, potentially reaching as high as $400,000 along the Cyclical Pivot trend line.
Even under a more conservative scenario modeled after the 2015–2017 cycle, Bitcoin is projected to reach a top slightly above $200,000.
Relative Strength Index signals room for further growth
The 1W Relative Strength Index (RSI) lends further credibility to this optimistic outlook. After reaching an overbought high of 88.50 in March 2024, the RSI corrected to a bearish low of 45 in September, signaling a temporary pullback.
Historically, Bitcoin’s RSI during bull cycles forms a series of peaks, each closely aligned with significant price highs.
If the current cycle mirrors the 2015–2017 bull run, Bitcoin could experience multiple RSI peaks before reaching its ultimate high, highlighting the strong growth potential and the likelihood of sustained upward momentum.
Road to $400,000: Key drivers
Bitcoin’s long-term trajectory remains aligned with historical bullish patterns, supported by macroeconomic factors, geopolitical tensions, and institutional adoption.
While short-term corrections are expected, the broader structure points to significant long-term growth potential, positioning Bitcoin as a key asset to watch ahead of its next rally.
However, market sentiment has been dampened by news of Google’s quantum computing chip Willow, which raises concerns about the future of Bitcoin’s encryption vulnerabilities.
Meanwhile, caution persists ahead of a critical week for economic data releases, including the US CPI, PPI, and jobless claims reports, which could influence the Federal Reserve’s interest rate outlook.
With markets pricing in an 88% chance of a 25-basis-point rate cut according to the CME FedWatchtool, a lower interest rate environment could provide support for risk assets like Bitcoin due to increased liquidity.
Analyst Ali Martinez has also raised concerns,cautioning that Bitcoin must maintain a price above $96,000 with relative consistency to avoid a potential collapse to $85,000.
As market participants weigh economic uncertainties and emerging technological challenges, Bitcoin’s ability to hold key support levels will remain crucial in the short term.
Featured image via Shutterstock


