- Solana’s breakout above $148.16 could signal a rally toward $210, making this resistance level a critical turning point.
- Strong bullish technical indicators, including a rising RSI and Balance of Power, suggest growing buyer strength as SOL nears resistance.
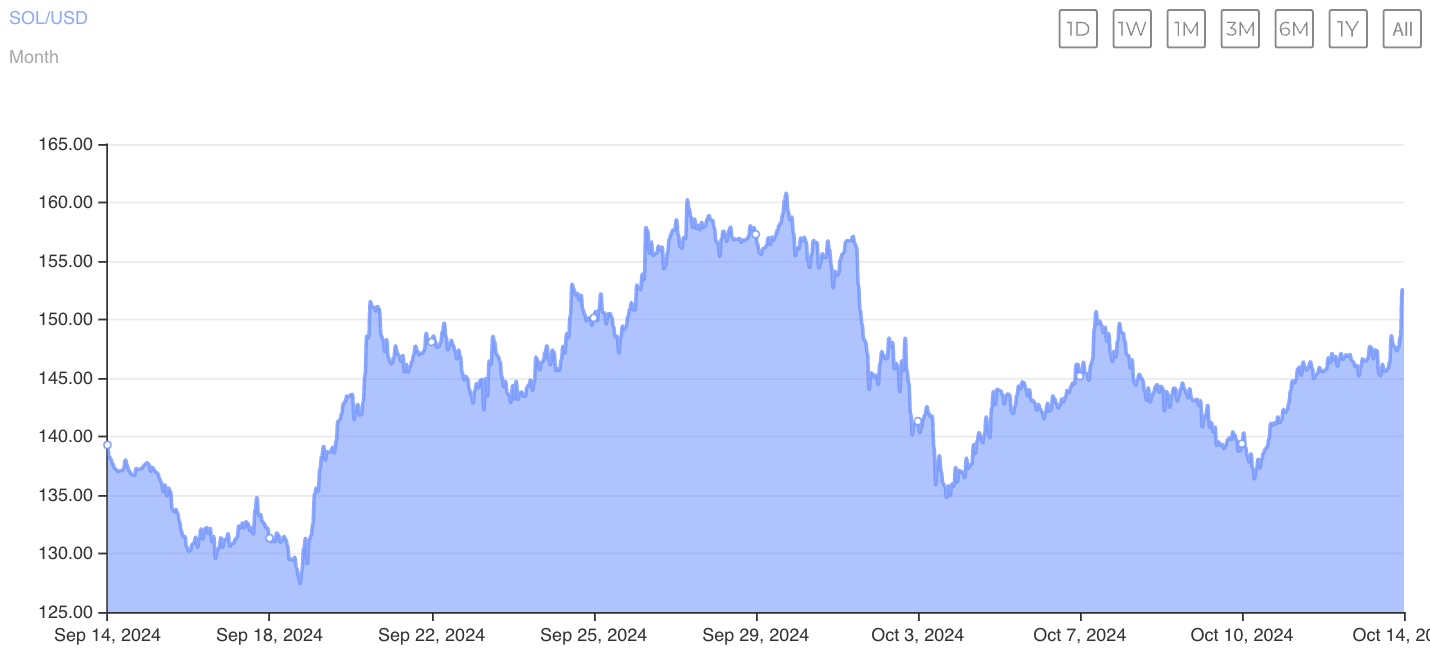
Following CNF’s previous update when stagnant Solana frustrated investors while experts revealed 2025 price predictions, Solana (SOL) is currently trading at $148.06, according to TradingView, approaching a critical resistance level of $148.16. This price point has been a challenge for SOL to surpass since early August, with multiple attempts being met by significant selling pressure.As of now, according to CoinMarketCap data, Solana (SOL) is trading at $147.62, up 0.44% in the past day but down 0.56%in the past week. See the SOL price chart below.

Bullish Technical Indicators Point to Uptrend
Several key technical indicators are supporting Solana’s bullish outlook. The Relative Strength Index (RSI), a tool used to measure market conditions, stands at 53.93. This indicates that buyers are gaining strength, though the asset is not yet overbought, leaving room for further upward movement.
An RSI above 70 would suggest overbought conditions, while a reading below 30 would imply oversold conditions. Solana’s current RSI indicates healthy momentum.
Additionally, Solana’s Balance of Power (BoP) is positive at 0.44, signaling that buyers are in control and attempting to push the price higher. Reiterating a previous CNF update, it was stated that,
Over the past year, Solana (SOL) has surged by 670%, largely due to advancements in the Solana blockchain and the broader bullish trend in altcoins like SOL, which has attracted widespread investor interest.
If demand for SOL continues, the asset may break above $148.16, with the next target being $209.90. However, if this resistance test fails, Solana could decline toward $110, making this test crucial for its near-term future.


