The price of Ethereum (ETH) has risen above the moving average lines and reached a high of $2,629. ETH price analysis by Coinidol.com.
Ethereum price long-term analysis: bearish
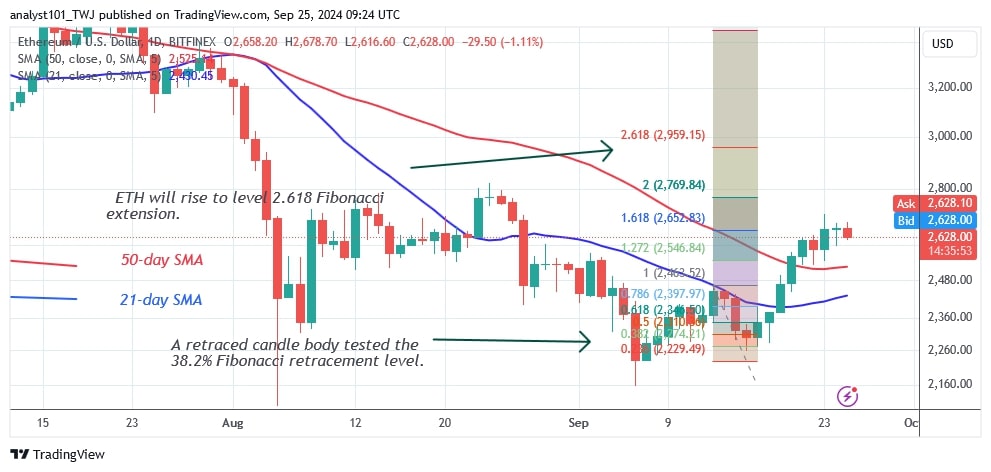
Currently, the bullish momentum is predicted to reach a high of $3,000. However, the bears will offer resistance at $2,800. During the rise on September 13, a body of candles tested the 38.2% Fibonacci retracement line. The retracement suggests that Ether will continue to move higher. According to the price projections, the largest altcoin will reach the 2.618 Fibonacci extension or $2,959.15.
However, Ether will fall if the current upswing does not break through the $2,800 resistance level. Since August 8, the bulls have failed to break above the $2,800 resistance level. In previous price moves, Ether was rejected at the $2,800 mark. The altcoin fell and retested the previous low above the $2,200 support.
Ethereum indicator analysis
Ether is currently in an uptrend as the price bars remain above the moving average lines. The current recovery is hitting a first barrier but remains above the moving average lines. The uptrend could end if the price declines and falls below the moving average lines. In the meantime, the altcoin is moving just above the moving averages.
Technical Indicators:
Resistance Levels – $4,000 and $4,500
Support Levels – $3.500 and $3,000

In which direction will Ethereum continue?
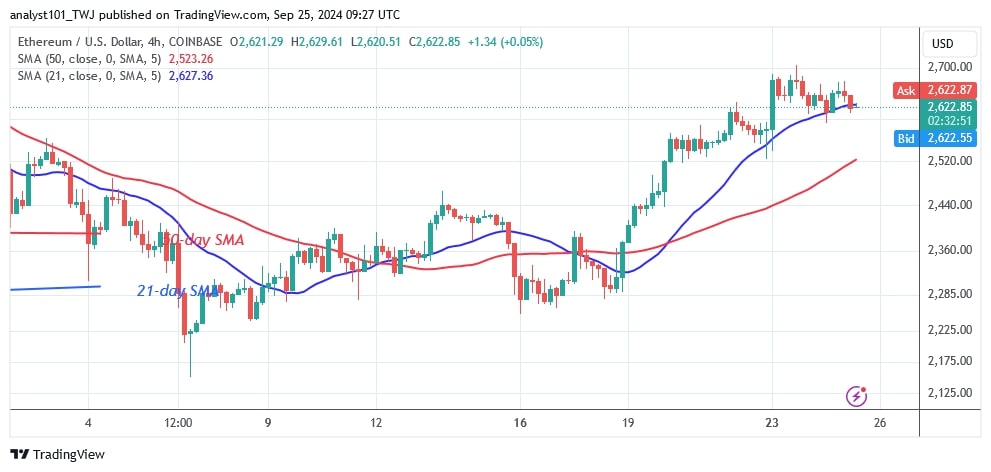
On the 4-hour chart, Ethereum is in an uptrend but has reached bullish fatigue.
The largest altcoin has started a downward movement after reaching resistance at $2,700. The altcoin is trading in the price range of $2,500 to $2,600. If the bulls break through the $2,700 mark, the positive trend will continue. In the meantime, Ether is consolidating above the $2,600 mark.

Disclaimer. This analysis and forecast are the personal opinions of the author. They are not a recommendation to buy or sell cryptocurrency and should not be viewed as an endorsement by CoinIdol.com. Readers should do their research before investing in funds.


