Since August 4, the leading meme coin Dogecoin (DOGE) has traded within a narrow range.
While many traders have benefited from this range-bound movement, the prolonged sideways action could delay the anticipated 36% price surge toward the $0.13 resistance level. Here’s how.
Dogecoin Moves Sideways Despite Spike in Buying Pressure
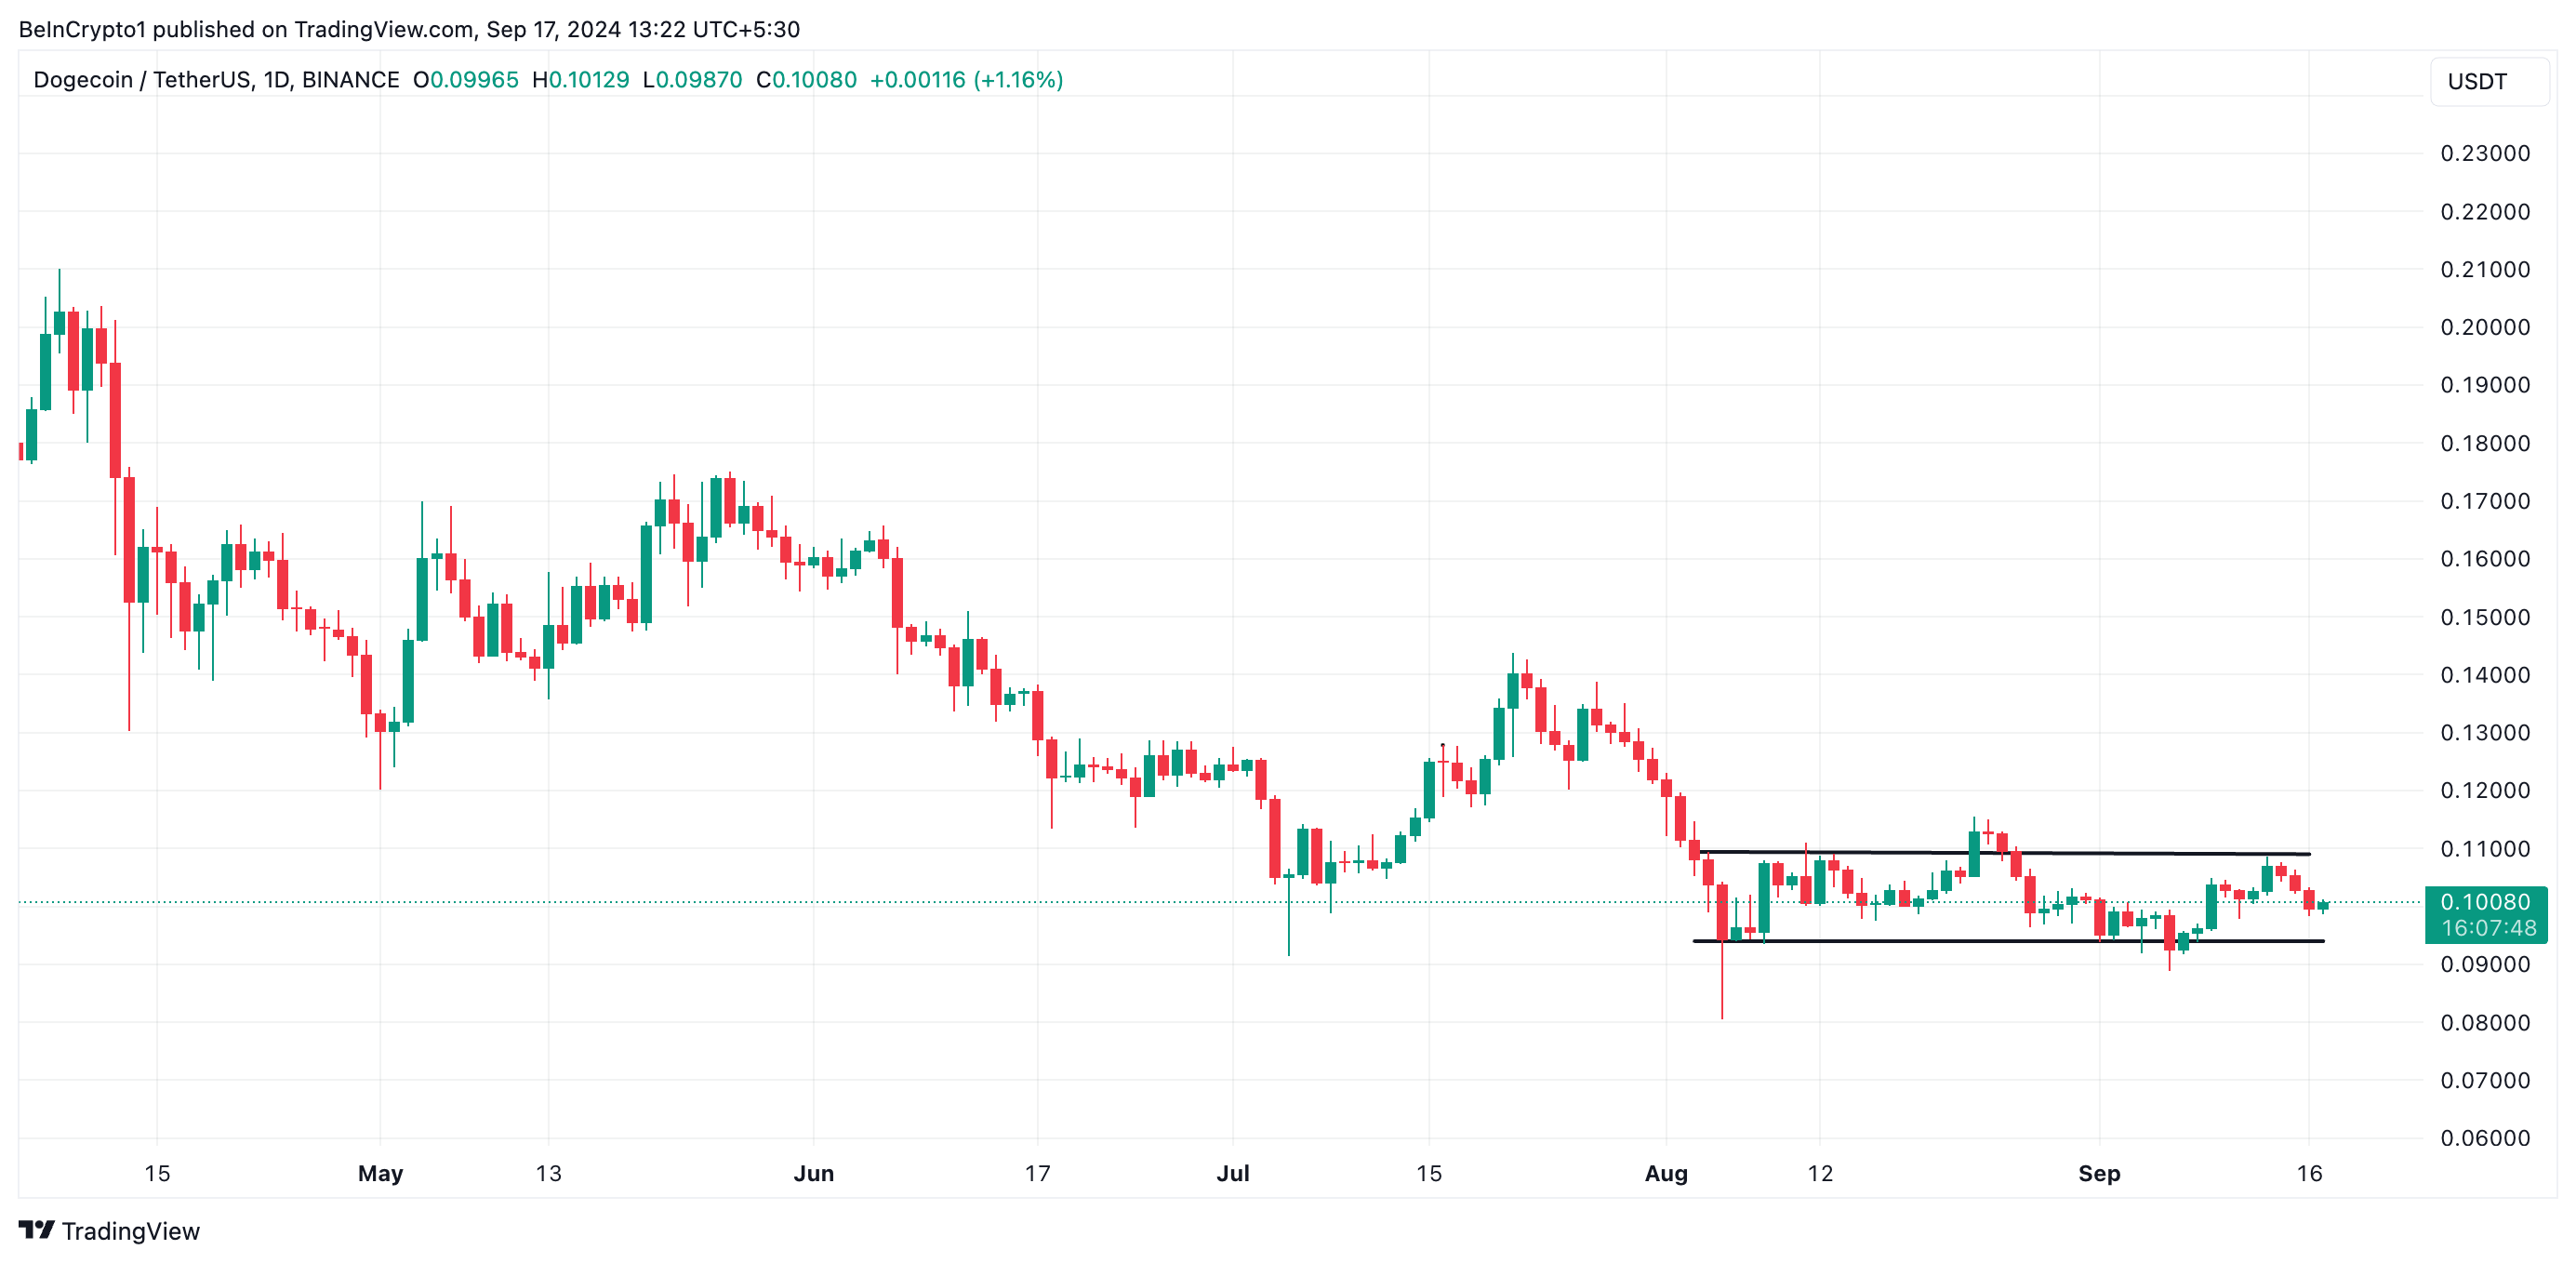
Since August 4, Dogecoin has been trading within a horizontal channel, a pattern where the price moves between a defined range. The upper boundary of this channel forms resistance at $0.10, while the lower boundary provides support at $0.09.
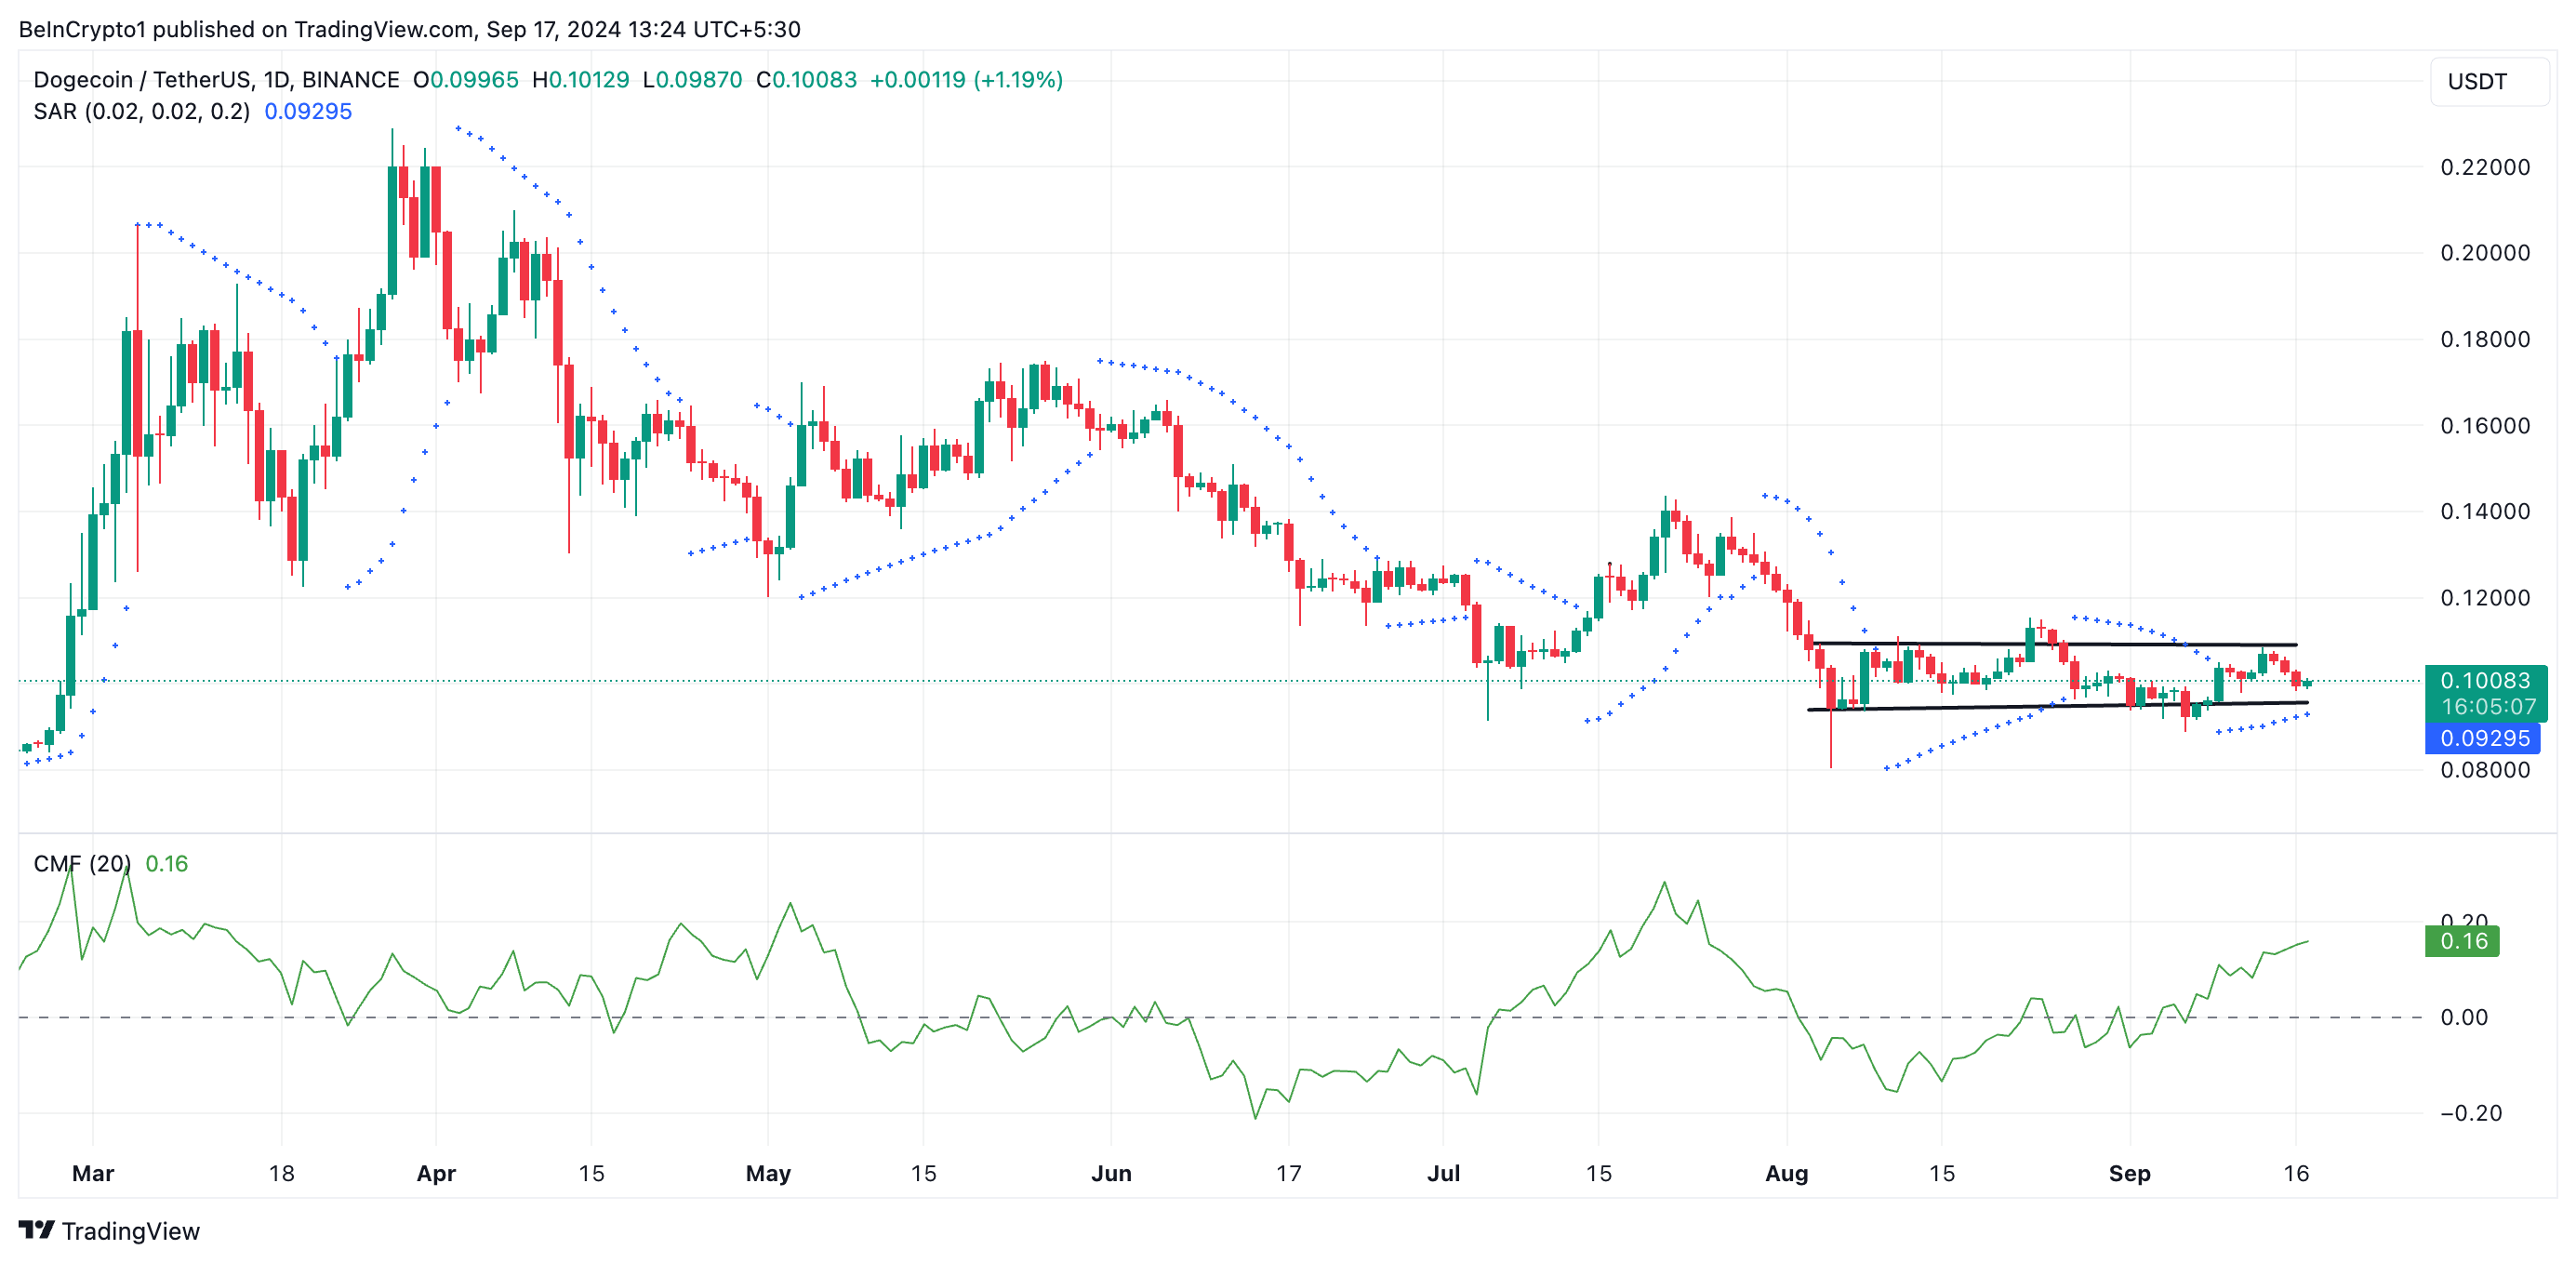
Despite increased buying activity over the past six weeks, as shown by key indicators like the Chaikin Money Flow (CMF), which has maintained an uptrend since early September and stands at 0.16, signaling liquidity inflow into the market, DOGE has only broken above the $0.10 resistance twice.

Additionally, the Parabolic Stop and Reverse (SAR) indicator shows a bullish bias, with its dots positioned below the price, indicating a strong bullish trend. However, despite these signals of growing buying pressure, DOGE has yet to break through its resistance since August 23, and its price is currently trending toward the lower boundary of the channel.
Read more: How To Buy Dogecoin (DOGE) and Everything You Need To Know

DOGE Price Prediction: Why Bulls Must Defend Support
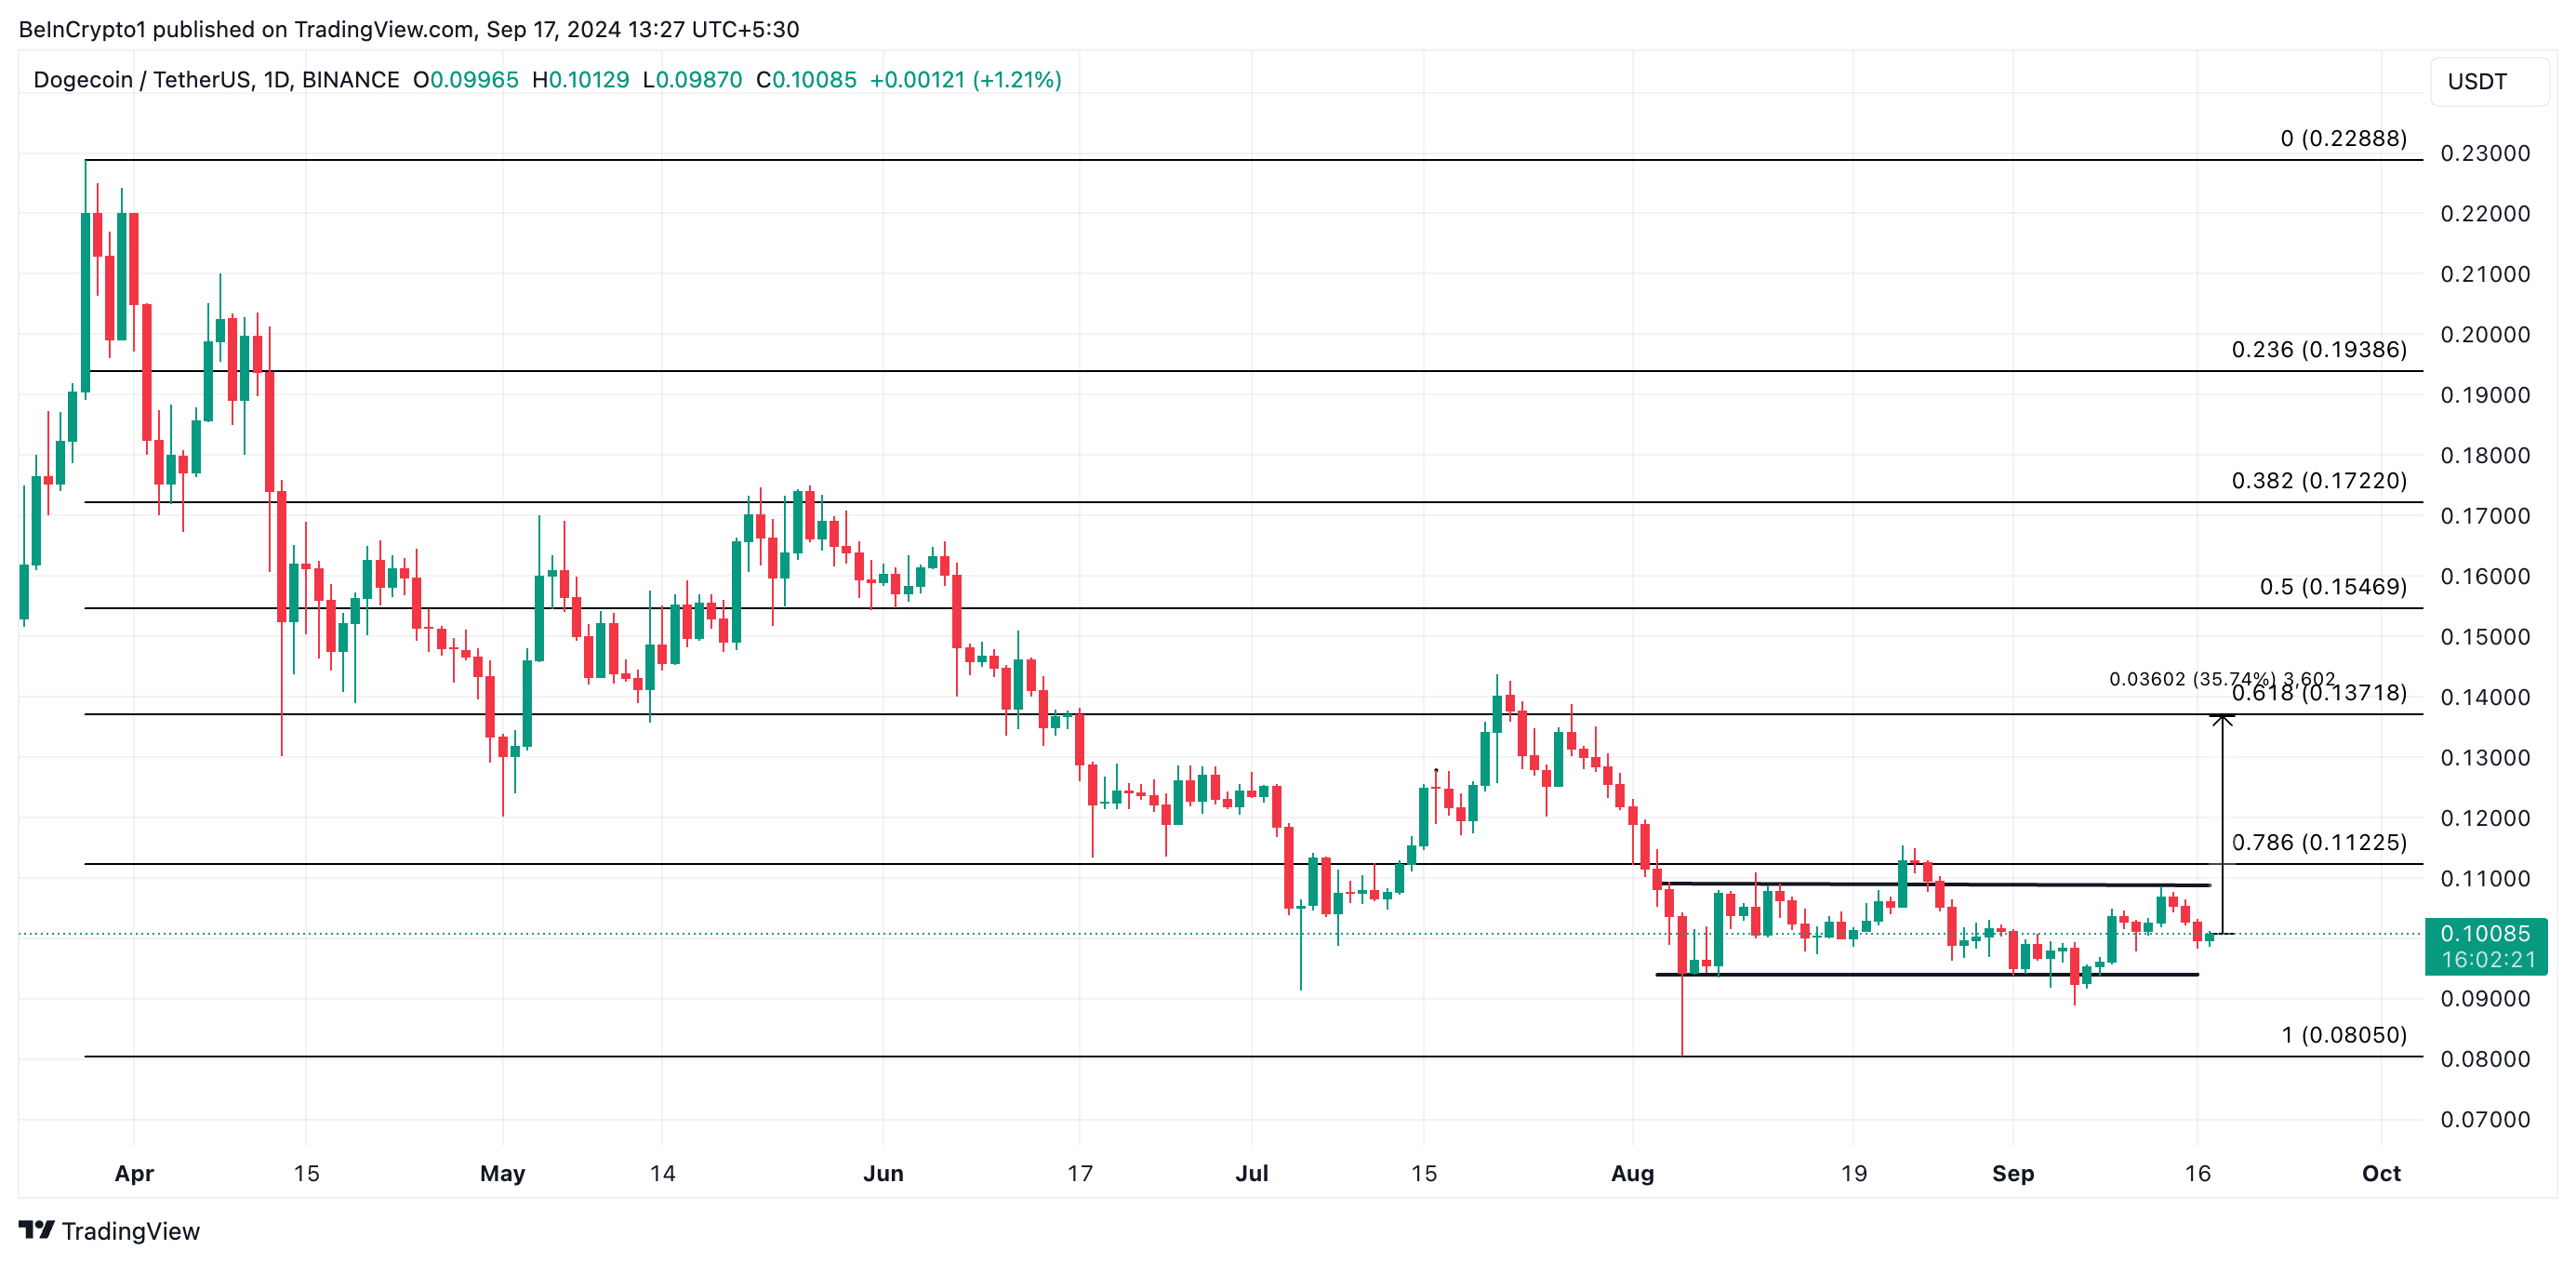
DOGE’s attempt to break below the lower boundary of its horizontal channel increases the risk of further price declines. If bulls fail to defend this support level, it could confirm a downtrend. In that case, DOGE’s price may drop further, potentially reaching the August 5 low of $0.08,
Read more: Best Crypto Mining Games In 2024

However, this bearish prediction might be invalidated if Dogecoin’s price witnesses a rebound. In that scenario, the meme coin’s price may rally by 36% toward resistance formed at $0.13.
Since August 4, the leading meme coin Dogecoin (DOGE) has traded within a narrow range.
While many traders have benefited from this range-bound movement, the prolonged sideways action could delay the anticipated 36% price surge toward the $0.13 resistance level. Here’s how.
Dogecoin Moves Sideways Despite Spike in Buying Pressure
Since August 4, Dogecoin has been trading within a horizontal channel, a pattern where the price moves between a defined range. The upper boundary of this channel forms resistance at $0.10, while the lower boundary provides support at $0.09.
Despite increased buying activity over the past six weeks, as shown by key indicators like the Chaikin Money Flow (CMF), which has maintained an uptrend since early September and stands at 0.16, signaling liquidity inflow into the market, DOGE has only broken above the $0.10 resistance twice.

Additionally, the Parabolic Stop and Reverse (SAR) indicator shows a bullish bias, with its dots positioned below the price, indicating a strong bullish trend. However, despite these signals of growing buying pressure, DOGE has yet to break through its resistance since August 23, and its price is currently trending toward the lower boundary of the channel.
Read more: How To Buy Dogecoin (DOGE) and Everything You Need To Know

DOGE Price Prediction: Why Bulls Must Defend Support
DOGE’s attempt to break below the lower boundary of its horizontal channel increases the risk of further price declines. If bulls fail to defend this support level, it could confirm a downtrend. In that case, DOGE’s price may drop further, potentially reaching the August 5 low of $0.08,
Read more: Best Crypto Mining Games In 2024

However, this bearish prediction might be invalidated if Dogecoin’s price witnesses a rebound. In that scenario, the meme coin’s price may rally by 36% toward resistance formed at $0.13.


