The price of Ethereum (ETH) has remained above the critical support level of $2,300. Price analysis by Coinidol.com.
Ethereum price Long-term analysis: bearish
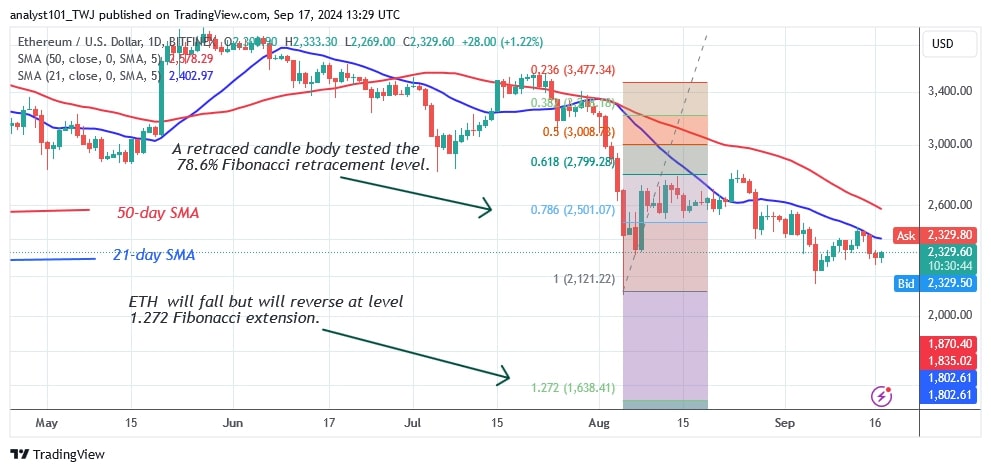
On September 6, as reported by Coinidol.com before, the bears broke through key support and hit a low of $2,156, but the bulls bought the dips. The bears are hoping for a return to the psychological price level of $2,000.00. If the bears breach the support at $2,000, Ether will fall to the 1.272 Fibonacci extension or the low at $1,638.
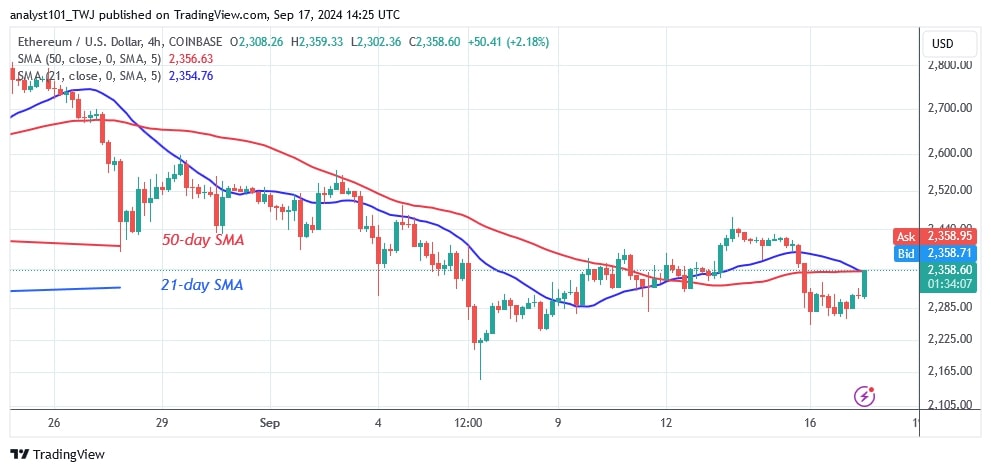
However, the bearish scenario was interrupted as the bulls bought the dips. Ether rebounded from the key support mentioned above and retested the 21-day SMA. The moving average lines have put the brakes on the uptrend. A break above the moving average lines would mean a continuation of the uptrend. The current value of Ether is $2,378.
Ethereum indicator analysis
The price bars are below the moving average lines and are repelled by the 21-day SMA. The moving average lines are the price barriers to the upside. Ether will fall if it is rejected at the 21-day moving average line.
Technical Indicators:
Resistance Levels – $4,000 and $4,500
Support Levels – $3.500 and $3,000

What is the next direction for Ethereum?
Ethereum is trading in a narrow range, above the key support of $2,300 but below the moving average lines. The bears are steadily pushing the cryptocurrency towards the key support of $2,300. The upside will start if the bulls continue to defend the existing support at $2,300.

Disclaimer. This analysis and forecast are the personal opinions of the author. They are not a recommendation to buy or sell cryptocurrency and should not be viewed as an endorsement by CoinIdol.com. Readers should do their research before investing in funds.


