Following a minor rejection near the $0.64 resistance zone, the price retraced to the broken 200-day moving average, validating the bullish breakout.
This movement signifies a positive market sentiment, with the price targeting a reclaim of the $0.64 resistance.
XRP Analysis
By Shayan
The Daily Chart
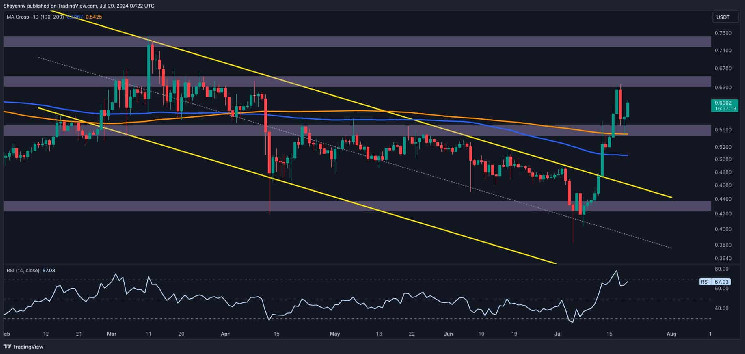
A thorough analysis of the daily chart reveals that Ripple has maintained its upward trajectory toward the significant $0.64 resistance zone, a key threshold on the daily timeframe.
However, the price encountered slight resistance near this pivotal level, resulting in a pullback toward the broken 200-day moving average at $0.54. Despite this, XRP experienced increased buying pressure, initiating a new upward surge that confirmed the bullish sentiment in the market.
Consequently, buyers are keen to push the price above the $0.64 resistance in the mid-term. Nevertheless, given the elevated levels of the RSI indicator, a temporary period of sideways consolidation within the $0.53-$0.64 range is anticipated before buyers attempt to reclaim the critical $0.64 resistance.

The 4-Hour Chart
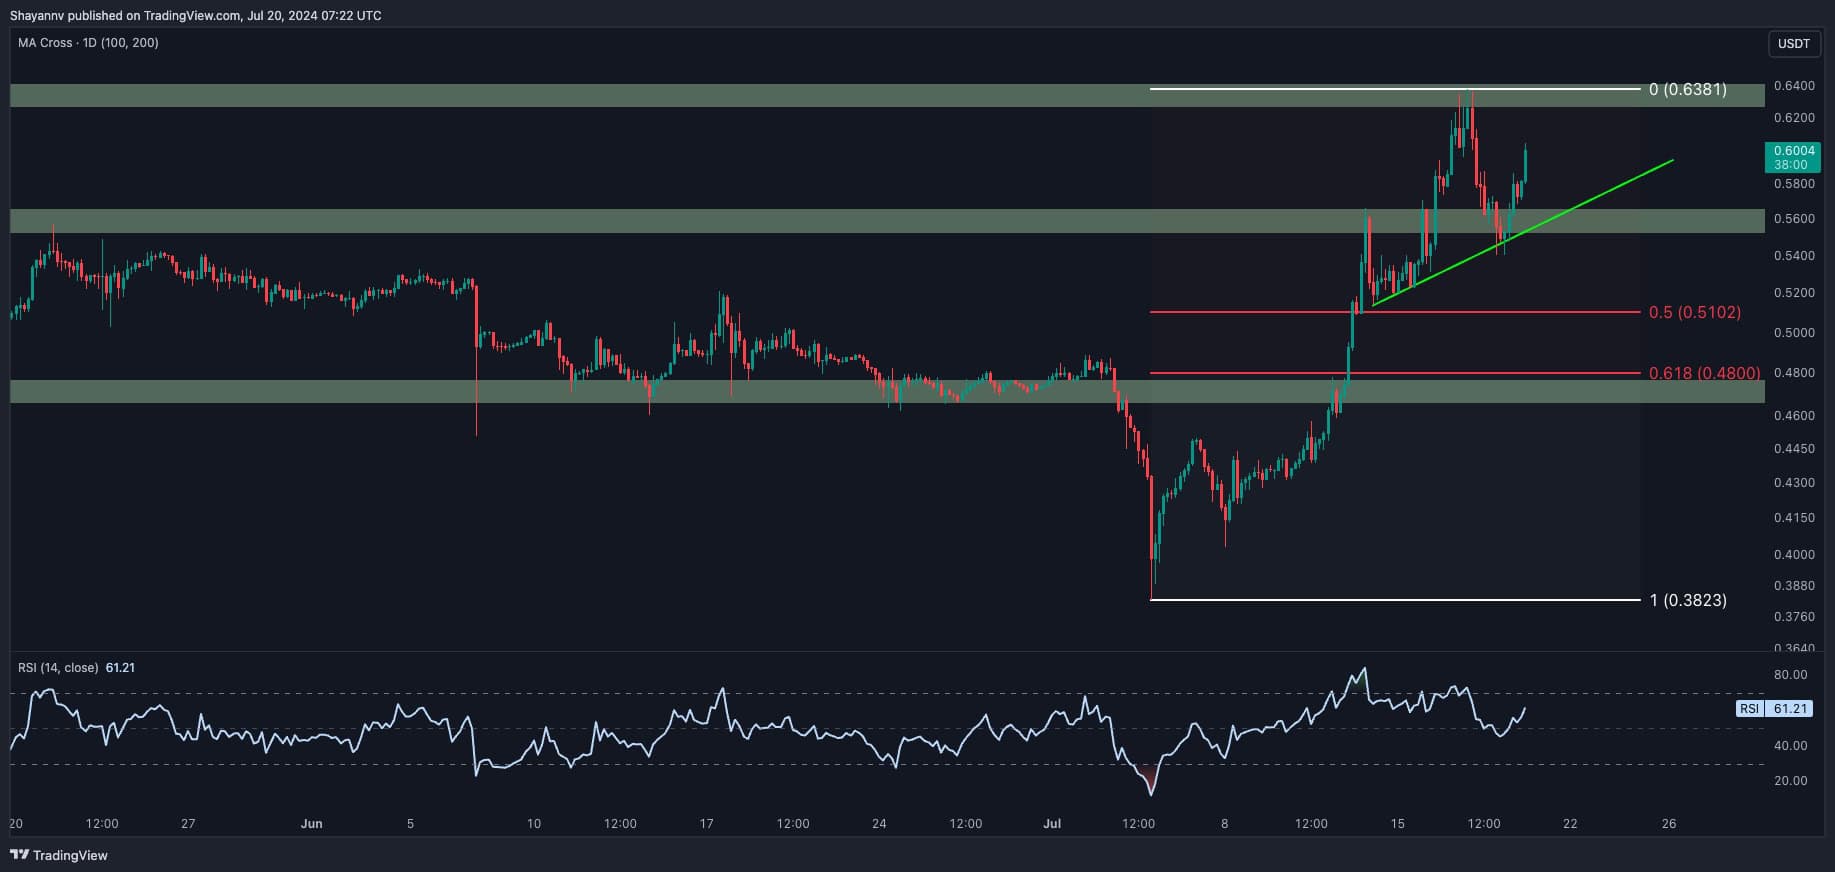
Examining the 4-hour chart, the continuation of the bullish rally is evident, with the price reaching the $0.64 level. However, Ripple encountered substantial selling pressure near this critical point, likely due to profit-taking from long positions.
This selling activity led to a notable pullback toward the $0.54 support region, where increased buying pressure initiated another surge.
The price has since formed an ascending trendline during these fluctuations. Currently, XRP is constrained by the dynamic support of this trendline and the significant $0.64 resistance level, suggesting a consolidation within this range until a breakout occurs. If the price breaks above the $0.64 mark, a new bullish trend toward the decisive $0.7 region is likely.


