The AI narrative continues to shape the market performance of top crypto-related projects, with The Graph (GRT) among those to ride this wave.
It comes as Bitcoin surges above $64,000 after weathering miner selling and government wallets dump.
The Graph hits $2 billion market cap
In the past week, GRT price has jumped 16% (at the time of writing), and is nearly 5% up in the past 24 hours. The token’s market cap has therefore reclaimed the $2 billion mark, while The Graph’s price hovers at $0.2172.
But this upside move in GRT price has the token trading at levels that have previously seen significant bearish movement.
This has been the case since The Graph recoiled from the $0.23 area ion June 17. Buyers have found it difficult to breach the supply wall at this level twice in the past month – first in the last week of June and again in early July.
Large holders sold 230 million GRT this past week
Per data from IntoTheBlock, on-chain signals for network growth and large transactions for The Graph are bearish.
This metric on large GRT holders is particularly notable as it suggests whales have sold in the past few days, with transactions in this category at over $100,000 per transfer.
On-chain data shows large holders have sold more than 230 million GRT worth over $46 million in the past week. The selling has come amid the upside flip for GRT price to suggest more profit-taking is likely.
Meanwhile, the indicator for the percentage of holders in profit or underwater shows more than 49% are out of money. About 2.2% are at the money, which leaves the metric largely neutral. But with so many in the red, an uptick in prices will likely see some look to take profits.

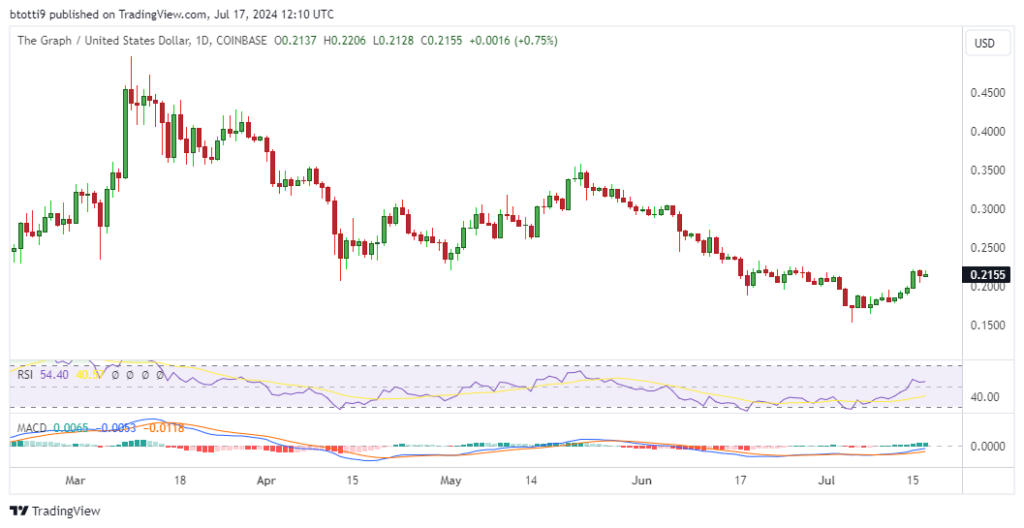
On the daily chart above, the RSI and MACD indicators point to potential upward movement. The technical outlook suggests GRT may continue higher, probably rising to the previous support area of $0.26.
But as the IntoTheBlock’s data shows, The Graph’s primary hurdle lies in the region between $0.22 and $0.30.
More addresses are in the red below this area. Meanwhile, an immediate demand zone in case of a downward flip could be in the $0.20 to $0.16 area.
The post The Graph price: Large holders have sold amid GRT surge appeared first on Invezz
The AI narrative continues to shape the market performance of top crypto-related projects, with The Graph (GRT) among those to ride this wave.
It comes as Bitcoin surges above $64,000 after weathering miner selling and government wallets dump.
The Graph hits $2 billion market cap
In the past week, GRT price has jumped 16% (at the time of writing), and is nearly 5% up in the past 24 hours. The token’s market cap has therefore reclaimed the $2 billion mark, while The Graph’s price hovers at $0.2172.
But this upside move in GRT price has the token trading at levels that have previously seen significant bearish movement.
This has been the case since The Graph recoiled from the $0.23 area ion June 17. Buyers have found it difficult to breach the supply wall at this level twice in the past month – first in the last week of June and again in early July.
Large holders sold 230 million GRT this past week
Per data from IntoTheBlock, on-chain signals for network growth and large transactions for The Graph are bearish.
This metric on large GRT holders is particularly notable as it suggests whales have sold in the past few days, with transactions in this category at over $100,000 per transfer.
On-chain data shows large holders have sold more than 230 million GRT worth over $46 million in the past week. The selling has come amid the upside flip for GRT price to suggest more profit-taking is likely.
Meanwhile, the indicator for the percentage of holders in profit or underwater shows more than 49% are out of money. About 2.2% are at the money, which leaves the metric largely neutral. But with so many in the red, an uptick in prices will likely see some look to take profits.

On the daily chart above, the RSI and MACD indicators point to potential upward movement. The technical outlook suggests GRT may continue higher, probably rising to the previous support area of $0.26.
But as the IntoTheBlock’s data shows, The Graph’s primary hurdle lies in the region between $0.22 and $0.30.
More addresses are in the red below this area. Meanwhile, an immediate demand zone in case of a downward flip could be in the $0.20 to $0.16 area.
The post The Graph price: Large holders have sold amid GRT surge appeared first on Invezz


