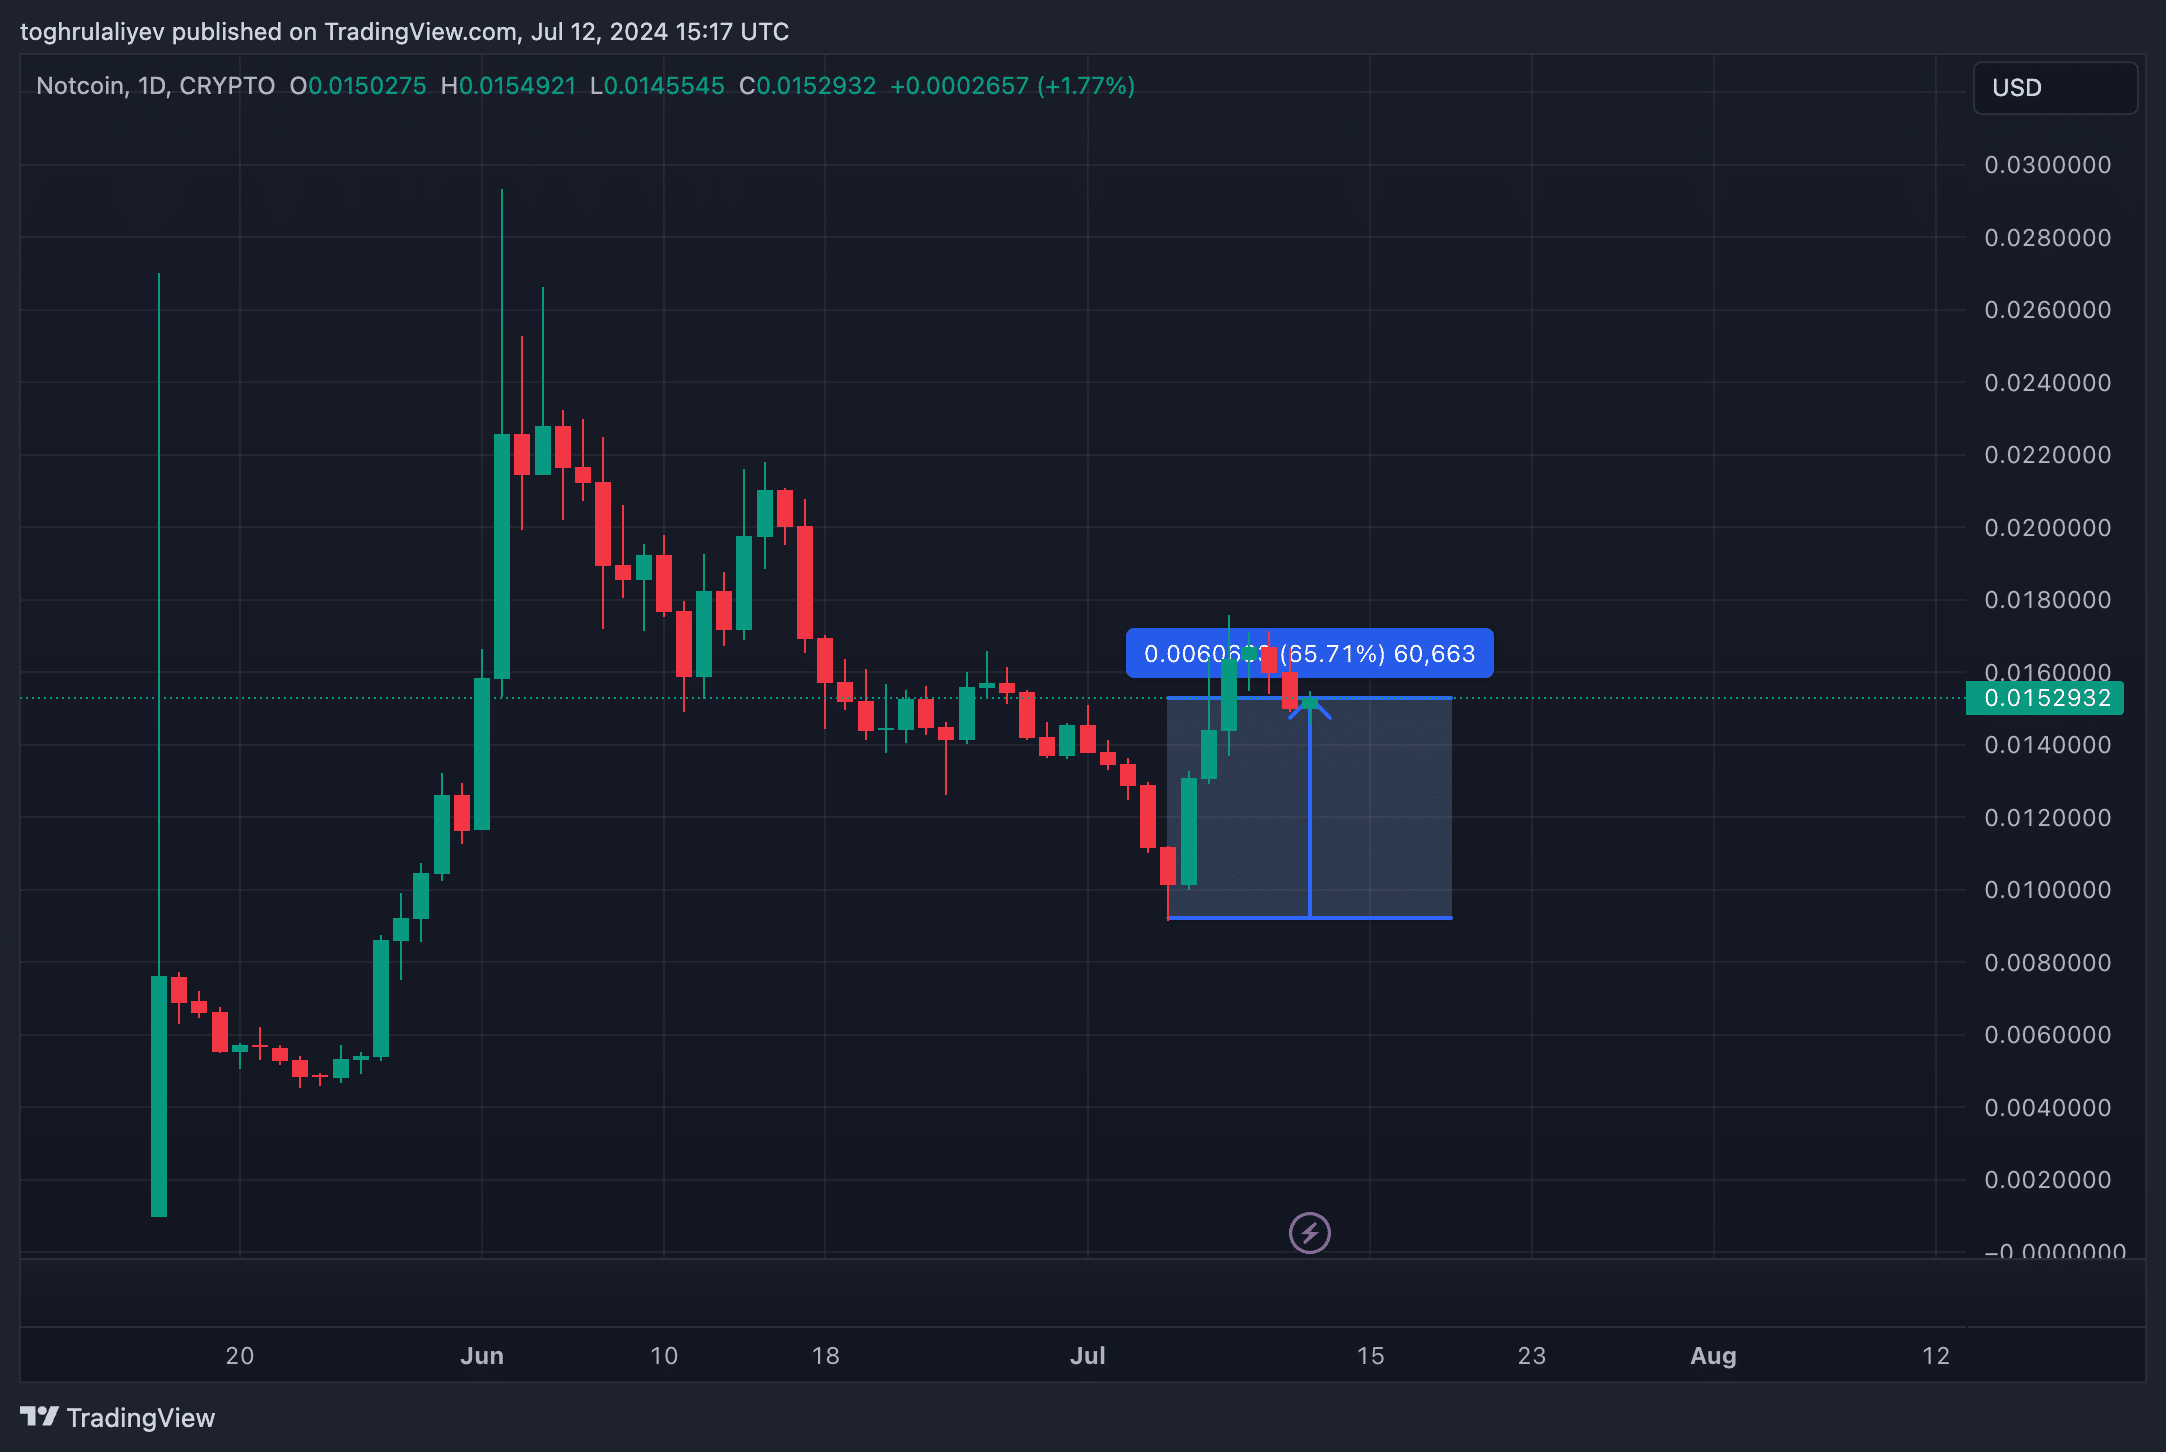
Notcoin astonished investors with a remarkable 65% surge last week. The impressive gain raises questions about its future price movements. This article analyzes its potential price trajectories for the upcoming week.
Table of Contents
Limited historical data
Notcoin started trading on May 16, making it a relatively new entry in the crypto market. Limited historical data makes precise predictions challenging, but several key indicators provide valuable insights into potential price behavior.
Fibonacci retracements and key levels
From the high on June 2 to the low on July 5, the 38.2% Fibonacci retracement aligns with the 61.8% retracement from the June 15 high to the July 5 low, both at $0.00169708.
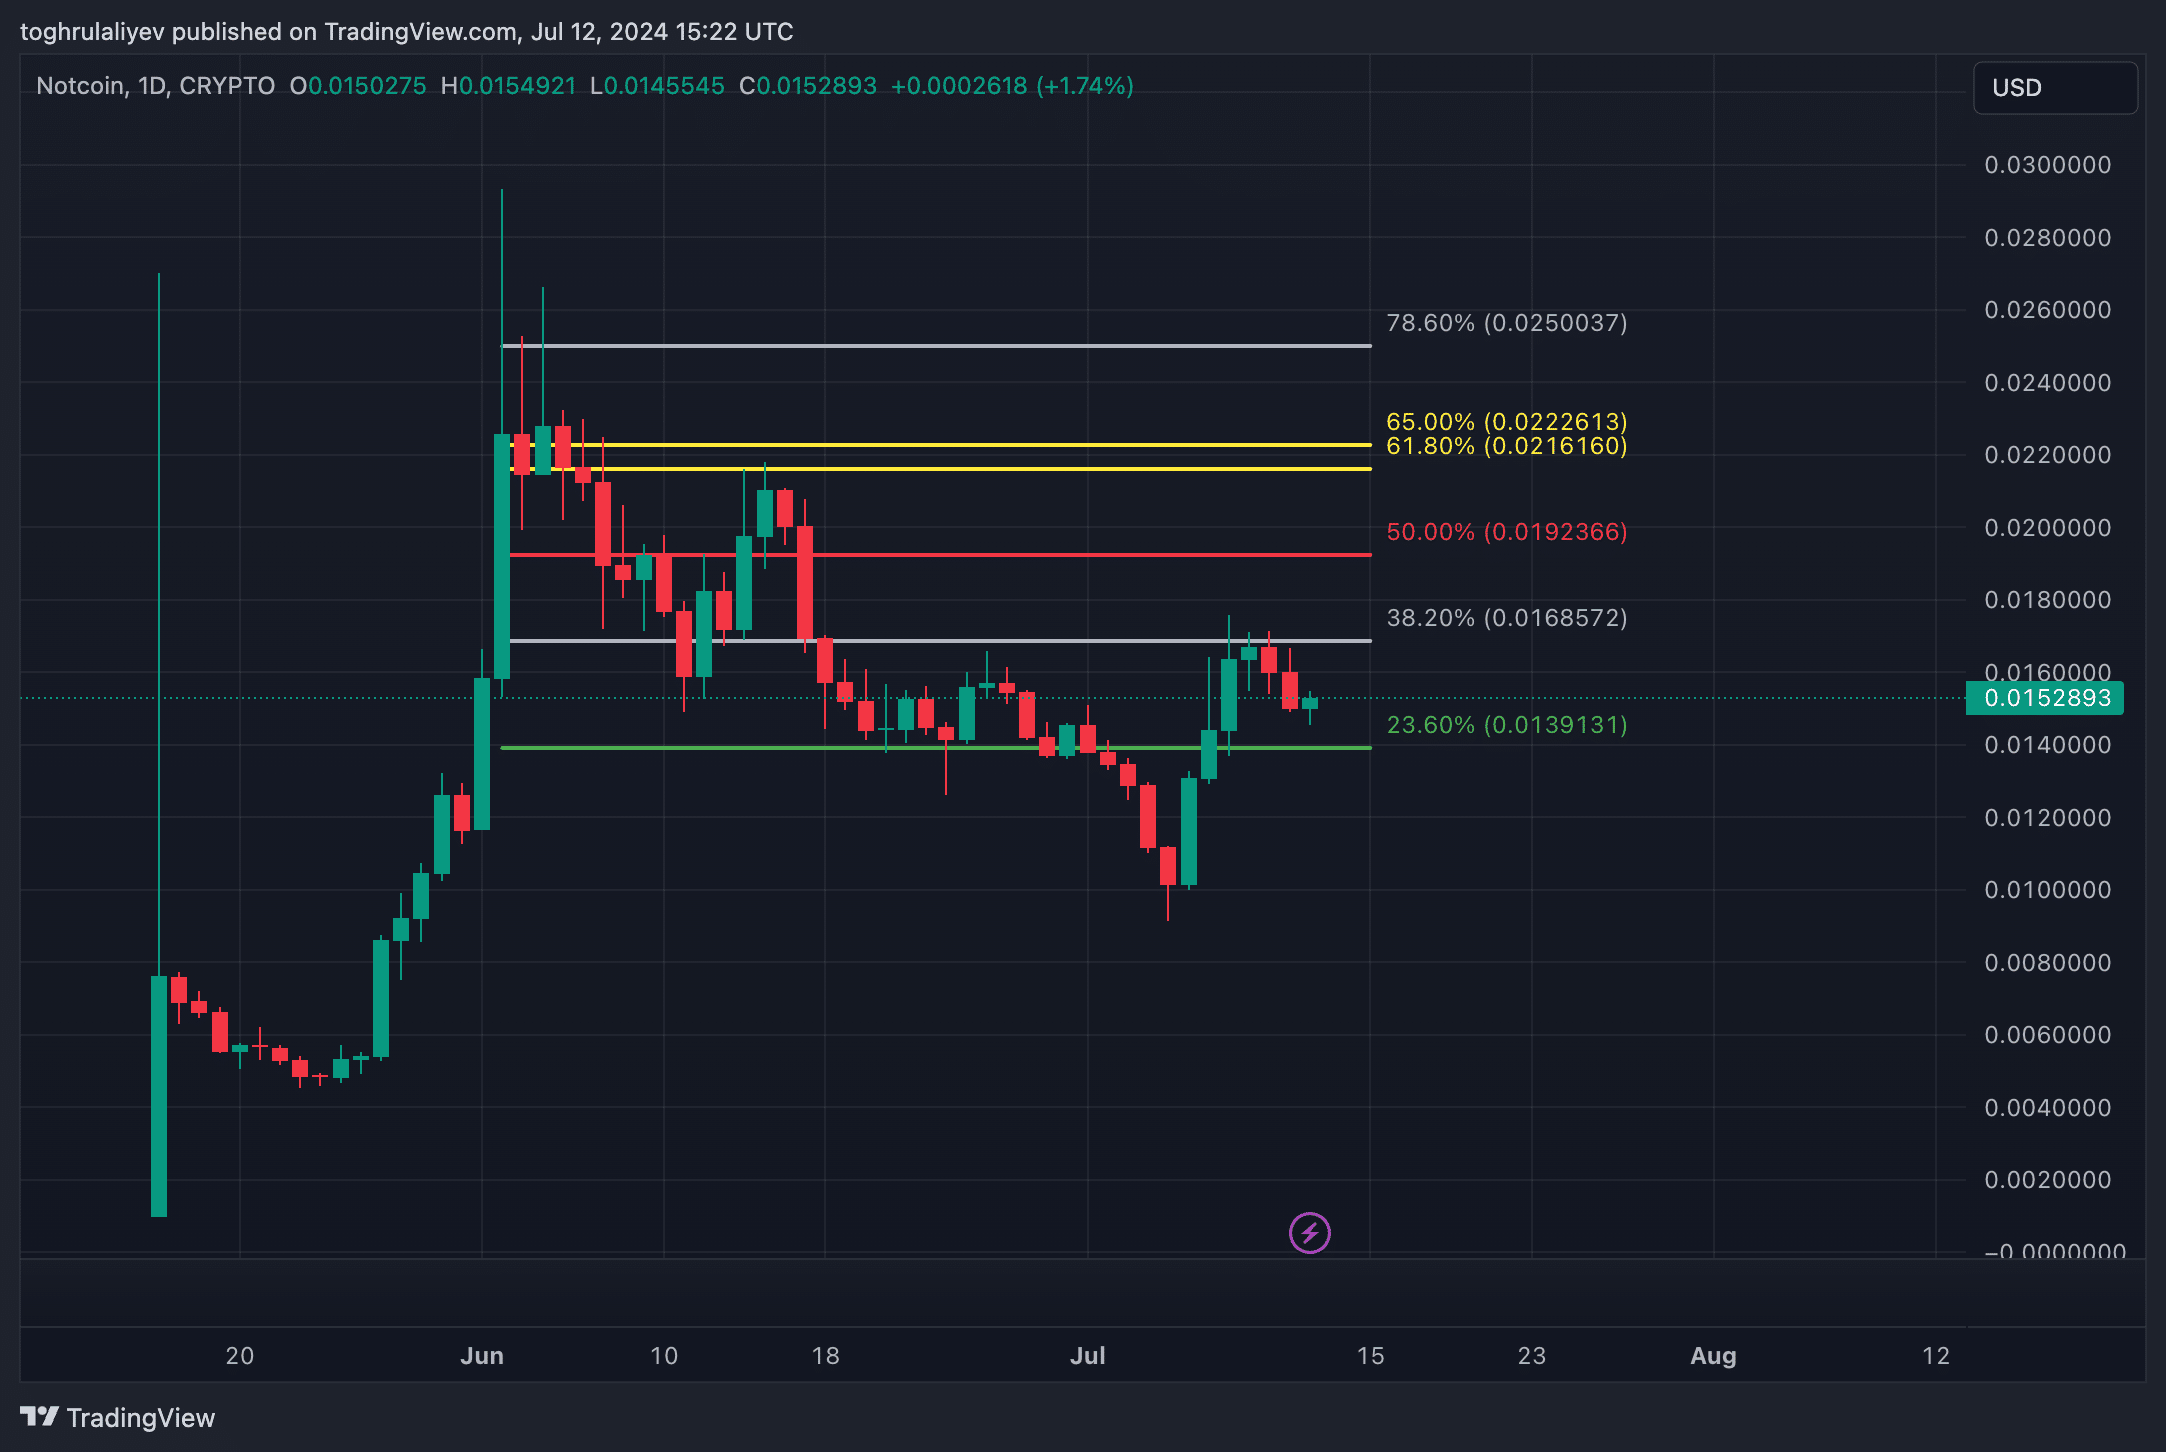
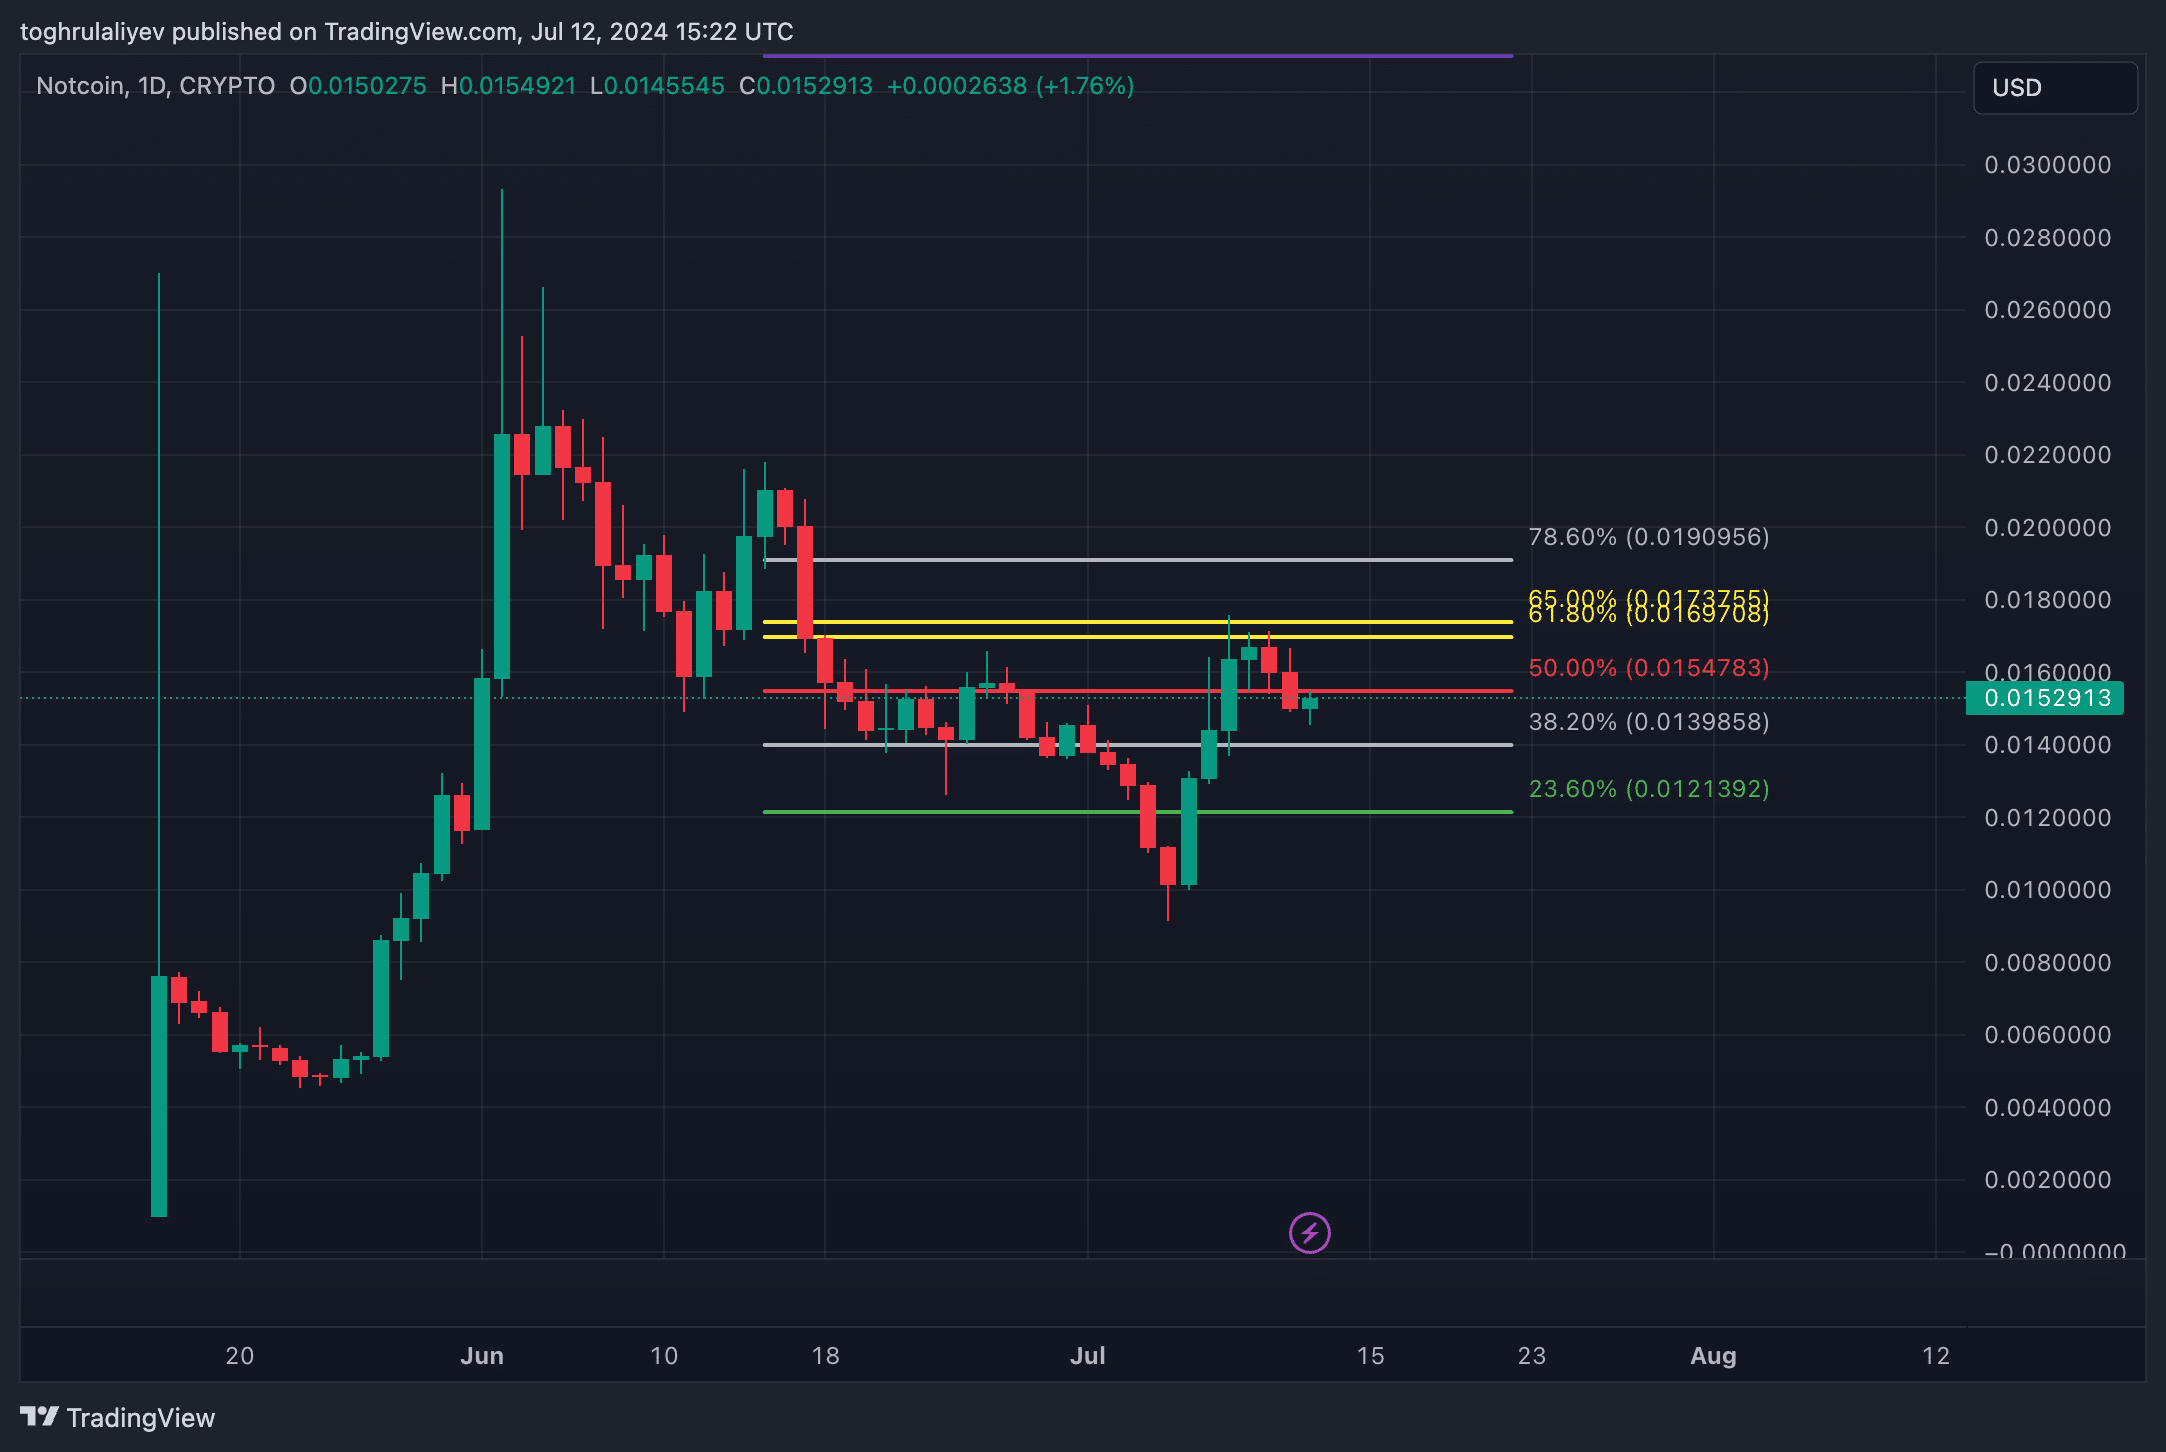
Additionally, the 50% retracement from the May 23 low to the June 2 high aligns with these levels.
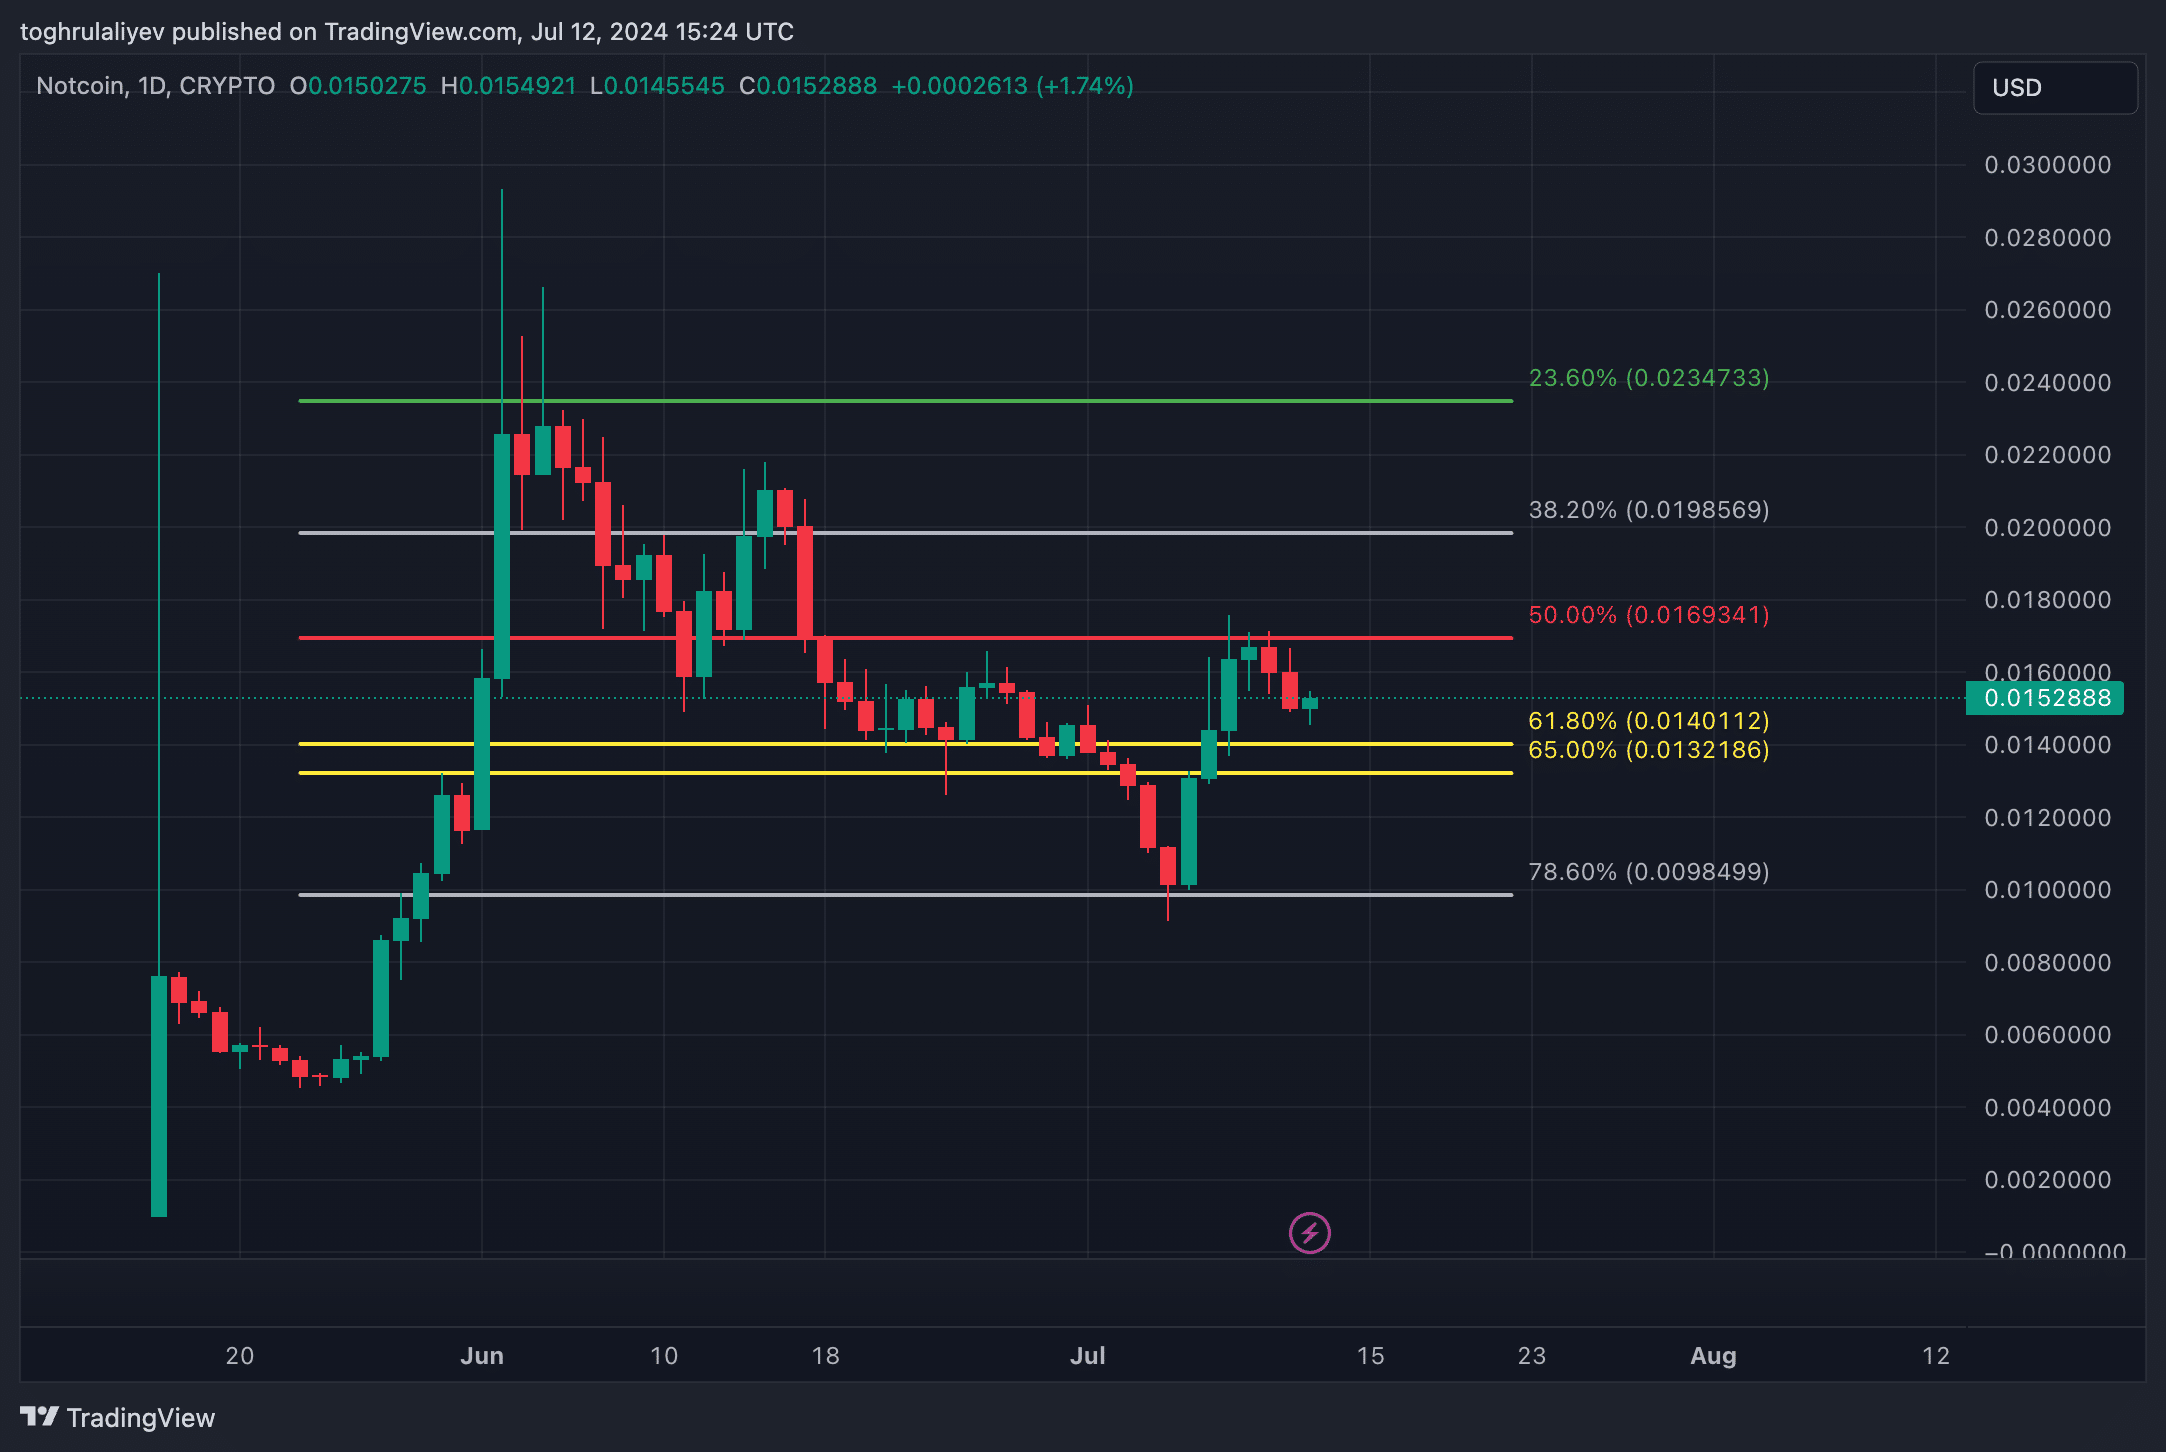
The confluence suggests a strong resistance level at around $0.00169, which has also acted as support multiple times. Breaking through this resistance could propel Notcoin to around $0.019.
Harmonic patterns and price targets
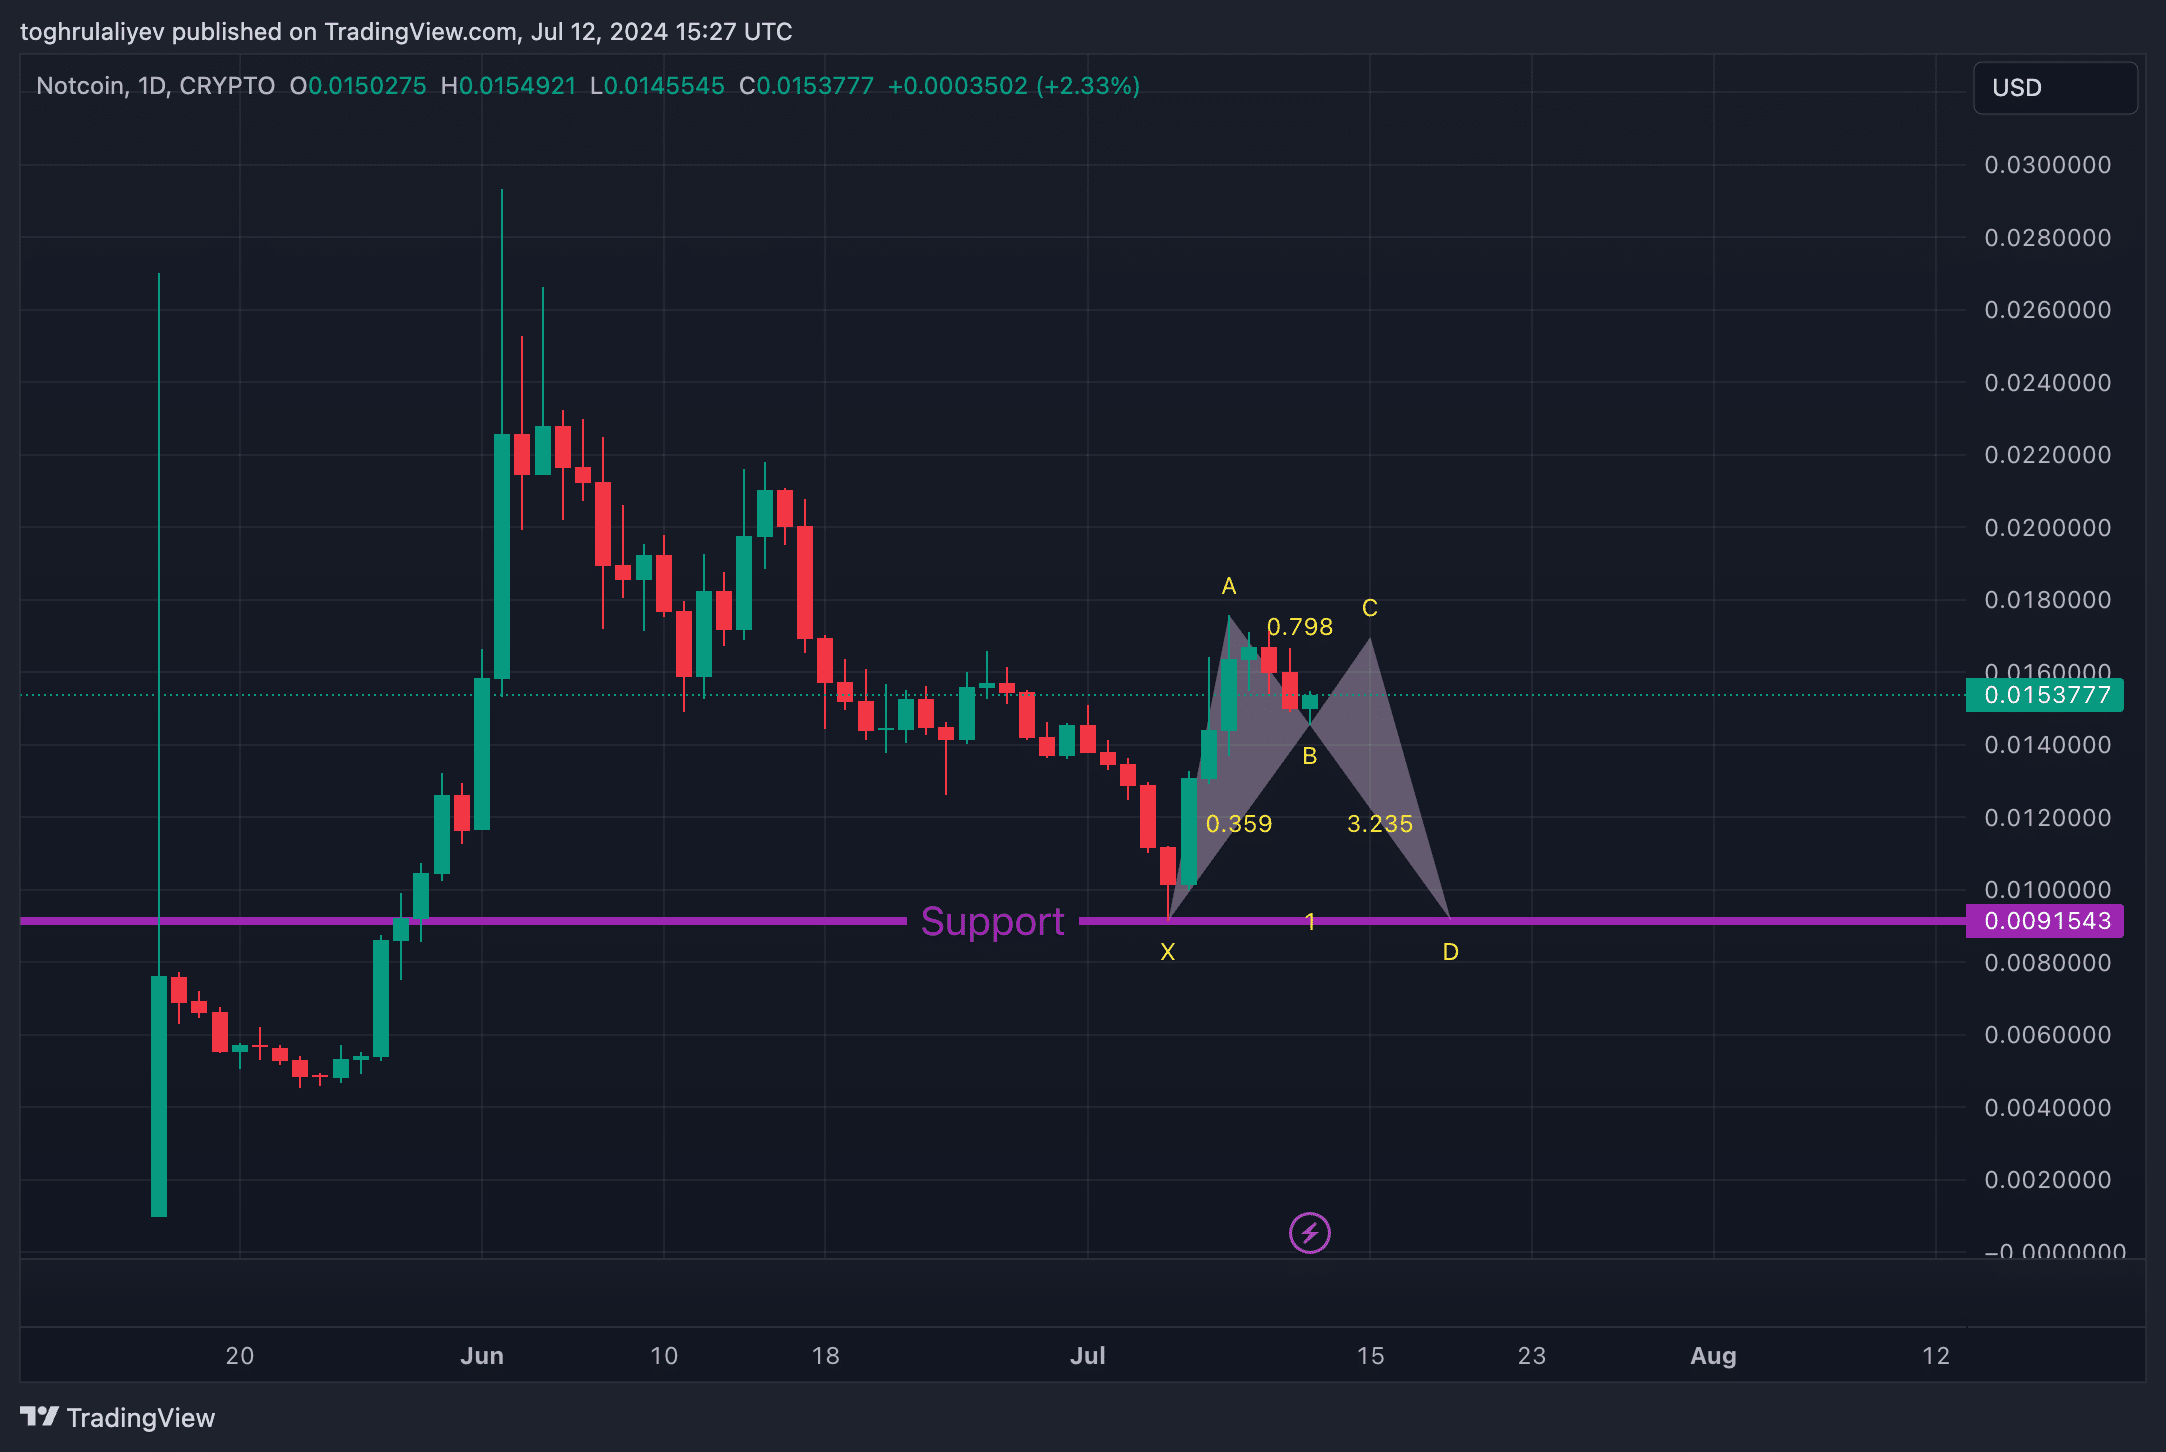
An emerging alt bat harmonic pattern suggests a potential rise to the 0.0169-0.017 area, where significant resistance may be encountered. After testing this level, Notcoin could experience a downturn, potentially falling to its strong support level at $0.0091543.
Strategy
- Long positions until the $0.0169 resistance level.
- If Notcoin tests this resistance and fails to break through, confirmed by a candle close, short positions to the $0.00915-$0.01 support range.
Disclosure: This article does not represent investment advice. The content and materials featured on this page are for educational purposes only.
Notcoin astonished investors with a remarkable 65% surge last week. The impressive gain raises questions about its future price movements. This article analyzes its potential price trajectories for the upcoming week.
Table of Contents

Limited historical data
Notcoin started trading on May 16, making it a relatively new entry in the crypto market. Limited historical data makes precise predictions challenging, but several key indicators provide valuable insights into potential price behavior.
Fibonacci retracements and key levels
From the high on June 2 to the low on July 5, the 38.2% Fibonacci retracement aligns with the 61.8% retracement from the June 15 high to the July 5 low, both at $0.00169708.


Additionally, the 50% retracement from the May 23 low to the June 2 high aligns with these levels.

The confluence suggests a strong resistance level at around $0.00169, which has also acted as support multiple times. Breaking through this resistance could propel Notcoin to around $0.019.
Harmonic patterns and price targets
An emerging alt bat harmonic pattern suggests a potential rise to the 0.0169-0.017 area, where significant resistance may be encountered. After testing this level, Notcoin could experience a downturn, potentially falling to its strong support level at $0.0091543.

Strategy
- Long positions until the $0.0169 resistance level.
- If Notcoin tests this resistance and fails to break through, confirmed by a candle close, short positions to the $0.00915-$0.01 support range.
Disclosure: This article does not represent investment advice. The content and materials featured on this page are for educational purposes only.


