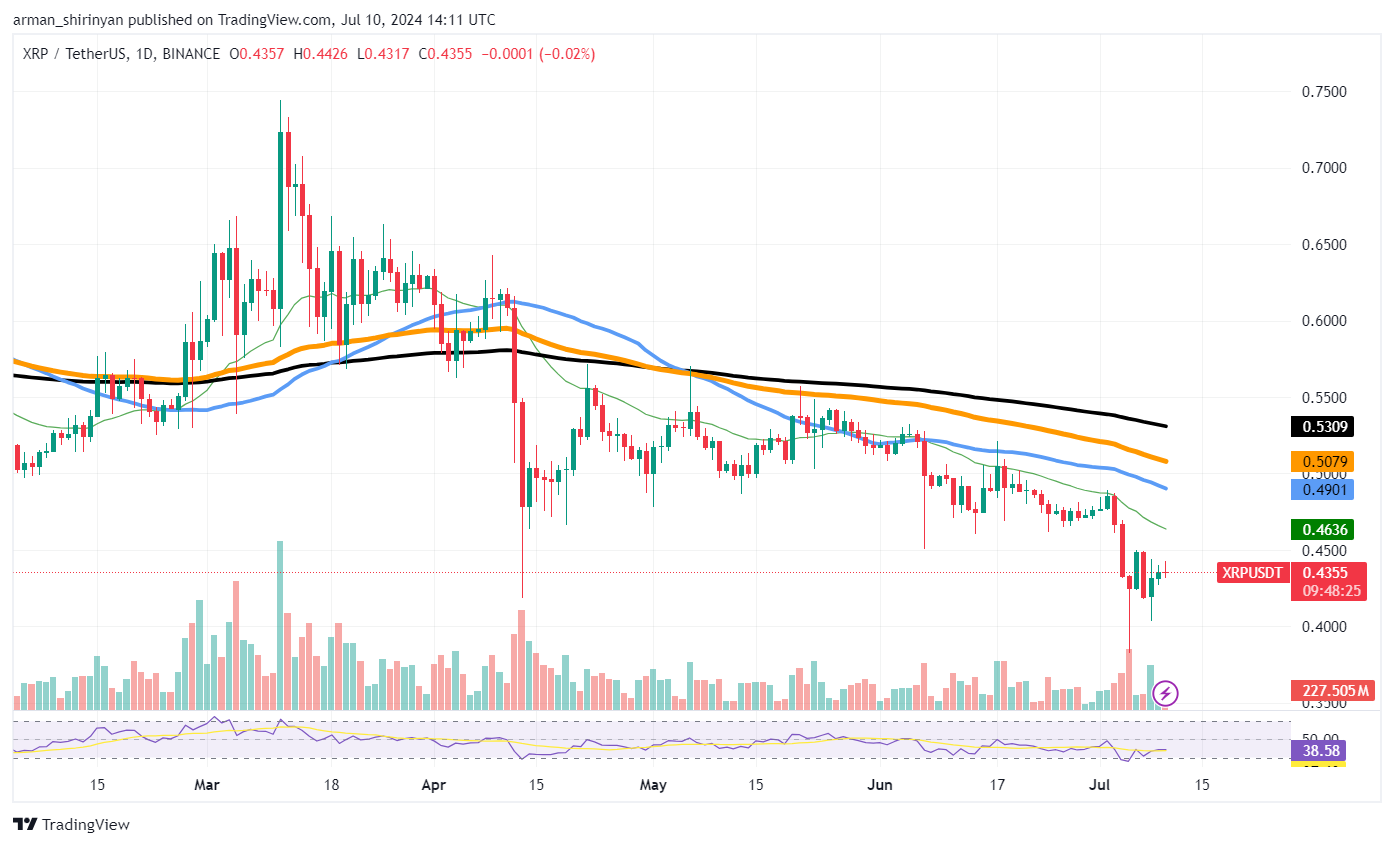
XRP has been showing us some recovery potential, but the current dynamic is clearly showing that buying power is just not there, and the asset is unlikely to recover in an explosive manner.
Looking at XRP’s daily chart in more detail reveals that the price has been unable to overcome notable resistance levels. The most significant obstacle is the $0.5 mark, which has shown to be a potent technical and psychological barrier. A lot of selling pressure has been applied to the price, which is currently trading at around $0.436 despite some upward movement.

The 50 EMA and 100 EMA lines, which both serve as resistance levels, suggest that unless there is a sizable influx of buying volume, the bearish trend may continue. The 200 EMA is significantly above the current price, which highlights the bearish long-term outlook barring a significant bullish reversal.
The volume analysis backs up the negative outlook. Investor interest appears to be lacking, as evidenced by the comparatively low buying volume. It is difficult for XRP to maintain any upward momentum in the absence of strong buying pressure. While not quite oversold, the RSI is trading at 39, which is in bearish territory.
Shiba Inu’s decline
Although Shiba Inu has been declining for some time, recent changes suggest that this trend may be about to reverse. The asset’s $0.000016 level has provided support for the price. Because it suggests that the market’s perception of SHIB may be shifting, this recovery is significant.
Bulls should take heart from the fact that SHIB has been able to maintain its position above the 50-day moving average (EMA) on the daily chart. The significant psychological resistance at $0.00002 is the next target for SHIB. Breaking above this mark could indicate a more robust bullish trend for the asset.
This possible recovery is supported by the volume analysis. A discernible surge in trading volume suggests that investors’ interest is growing. Additionally the RSI is rising, indicating a rise in buying pressure.
This optimistic outlook is further supported by on-chain data. The stability of the concentration of large holders, or whales, in SHIB indicates that significant investors are continuing to hold onto their positions. This consistency may offer a strong base on which the asset’s value may increase.
Major players are also more active, as seen by the rise in the quantity of large transactions. Given that large transactions can indicate confidence in the asset’s potential, this activity frequently results in more notable price movements.
Additionally, the general sentiment of the market is shifting in favor of cryptocurrencies – particularly SHIB. Assets like SHIB stand to gain from the general upward trend as the cryptocurrency market bounces back from recent downturns. SHIB is an appealing option at its current price point because investors are searching for opportunities in undervalued assets.
Solana’s death cross
The possibility of a “death cross” between the 100 and 50 EMA on Solana is looming on the horizon. The reason behind it is the inability of bulls to push SOL higher than the current threshold.
Solana has been exhibiting indications of a possible bearish technical indicator known as a death cross, which happens when a short-term moving average crosses below a long-term moving average.
The 50 EMA is about to pass below the 100 EMA in this instance. This pattern frequently indicates an impending decline. SOL is currently trading at $141, unable to overcome the resistance levels established by the 50 and 100 EMAs.
Though the bullish momentum appears to be fading, the trading volume has remained comparatively steady. Strong buying or selling pressure is not present as the RSI is circling the neutral zone. It seems that the market is feeling cautious about Solana. SOL has been impacted by the volatility that the larger cryptocurrency market has been going through.
Bulls have attempted to raise the price, but they have encountered fierce opposition. The death cross could materialize and cause SOL’s price to drop even further if the bulls are unable to maintain buying pressure. Solana may enter a bearish trend and drop to the next support level, which is around $130, if it is unable to break above the resistance levels.


