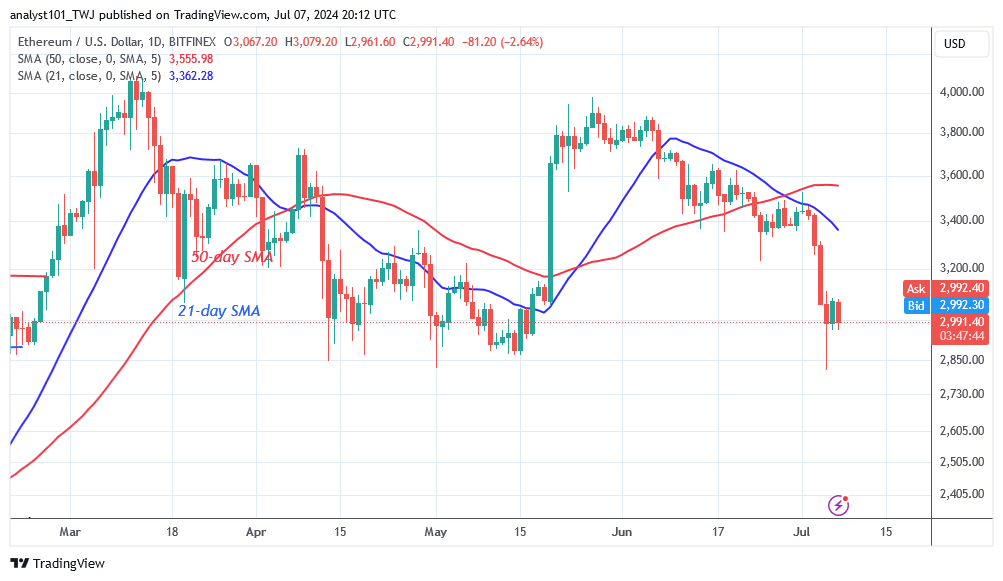
Cryptocurrency analysts of Coinidol.com report, the price of Ethereum (ETH) has declined from its low of $2,815 on July 5.
Long-term analysis of the Ethereum price: bearish
The current support level of $2,815 is the historical price level from April 13. The bulls have held the current support at $2,815 for the last three months. Over the past four days, the uptrend has stalled near the $3,000 high, while the decline has slowed above the $2,815 support level. In other words, the price of Ether is hovering between $2,800 and $3,000. If the largest altcoin rises and breaks through the $3,000 mark, the positive trend will resume. The altcoin will fall to $2,200 if it loses its current support. At the time of writing, Ether is worth $2,834.
Ethereum indicator analysis
Ether falls and then bounces above the $2,800 support level. Long candlestick tails indicate the critical support level. The extended candlestick tails signal significant buying pressure at the key support level. Ether could continue its upward movement above the important support level.

Technical indicators:
Key resistance levels – $4,000 and $4,500
Key support levels – $3,500 and $3,000
What is the next direction for Ethereum?
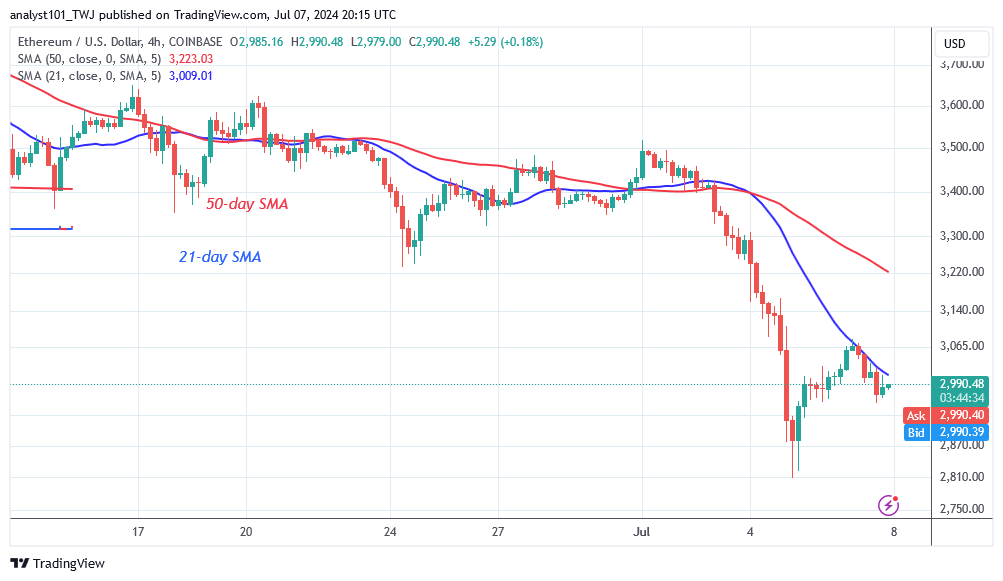
On the 4-hour chart, Ether has ended its slide above $2,809 and started a range-bound rise. The current price range of the altcoin is between $2,800 and $3,065. Ether has rallied twice after reaching the current support level of $2,800. Once the altcoin breaks above the 21-day simple moving average, it will resume its uptrend.

Disclaimer. This analysis and forecast are the personal opinions of the author. They are not a recommendation to buy or sell cryptocurrency and should not be viewed as an endorsement by CoinIdol.com. Readers should do their research before investing in funds.


