Ethereum (ETH) has experienced notable price movements recently, currently trading at $3,037. The intraday range has fluctuated between $2,803 and $3,096, with a market capitalization standing at $364 billion.
Ethereum
The 1-hour ETH/USD chart reveals a recent uptrend beginning at $2,803, marked by a significant bullish candle reaching $3,096 before a slight pullback. A bullish engulfing pattern indicates a potential continuation of this uptrend, though the last few drops suggest consolidation. Volume analysis shows a spike during the bullish move, but decreasing volume during consolidation suggests that if volume increases, the uptrend may continue.

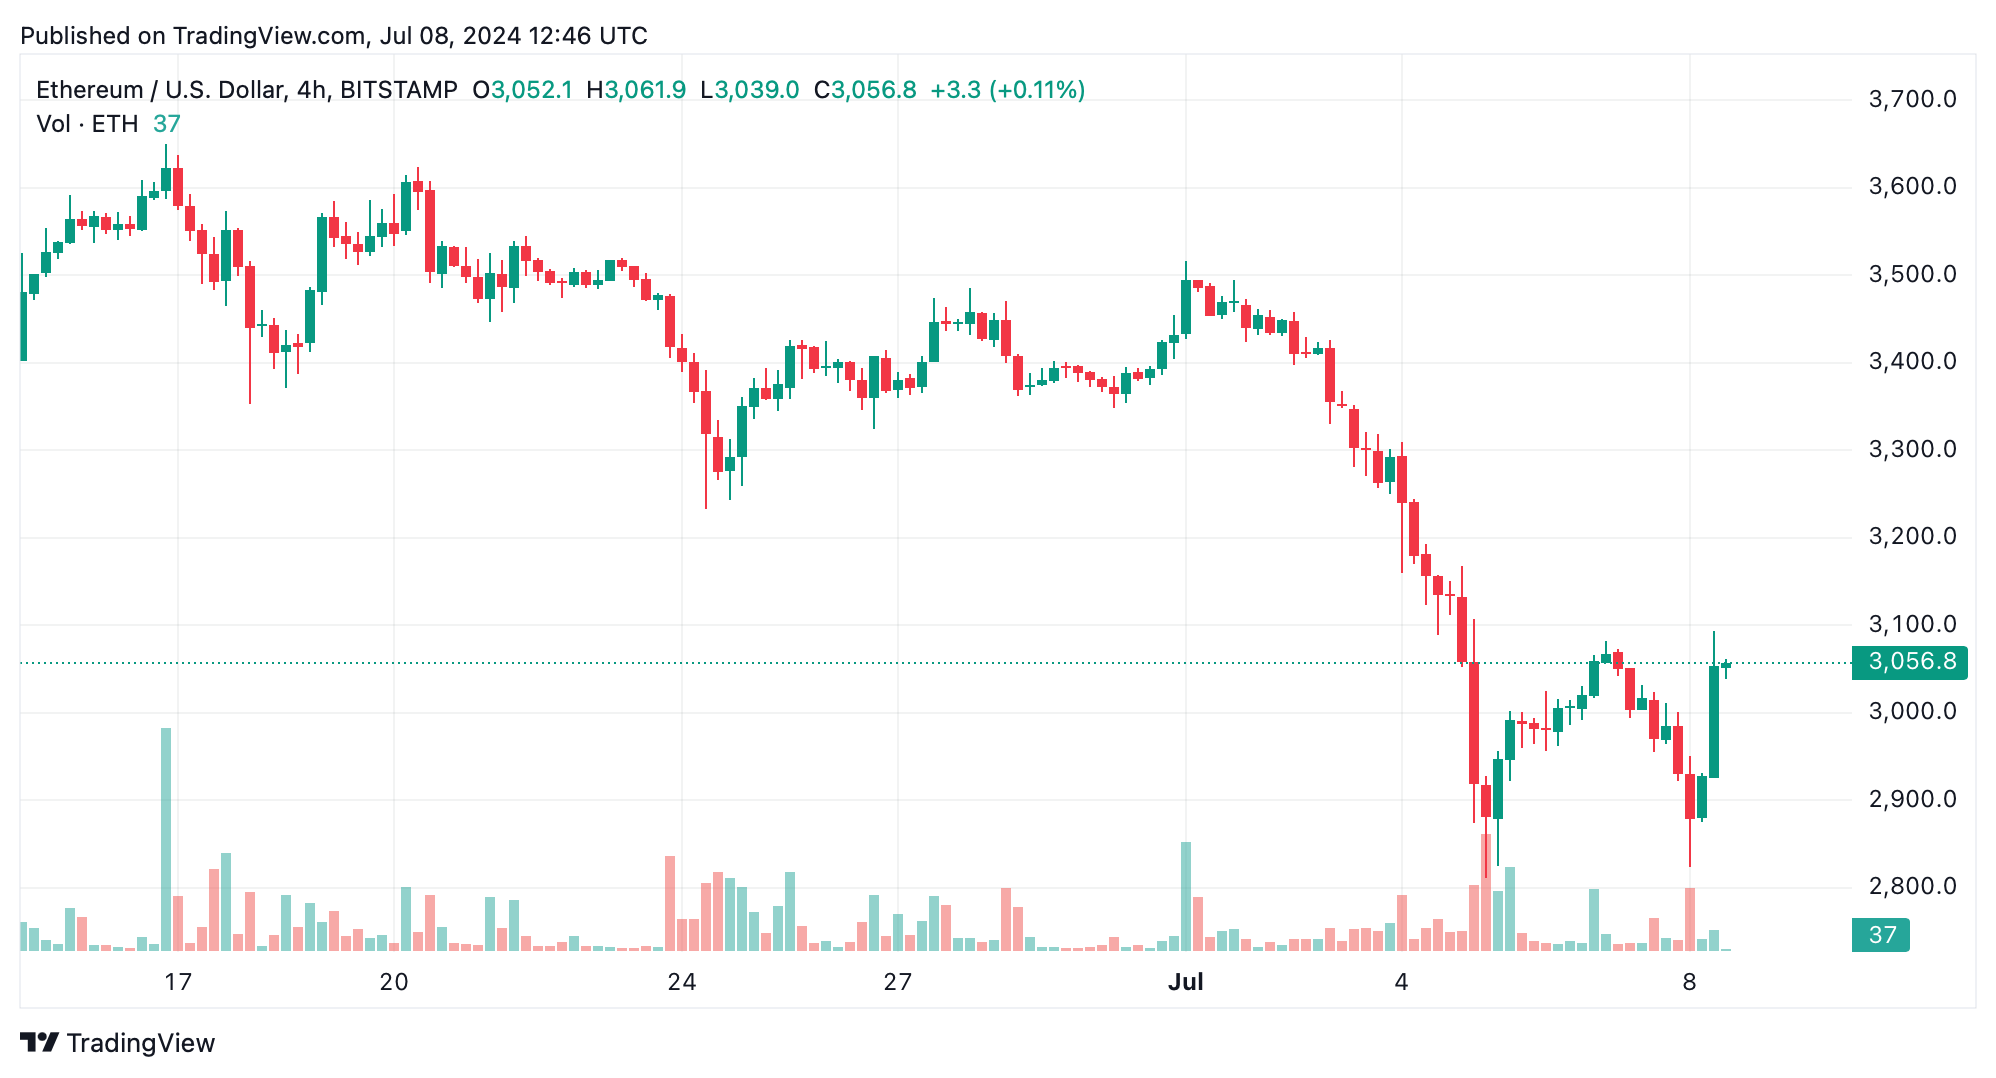
On the 4-hour ETH/USD chart, ether confirms a downward trend, recently bouncing from the $2,803 low. A strong upswing on July 8 signifies a significant bullish move, potentially indicating a short-term reversal. However, recent candles with small bodies and wicks also highlight indecision. Volume analysis supports this bullish move with higher volume, indicating genuine buying interest.

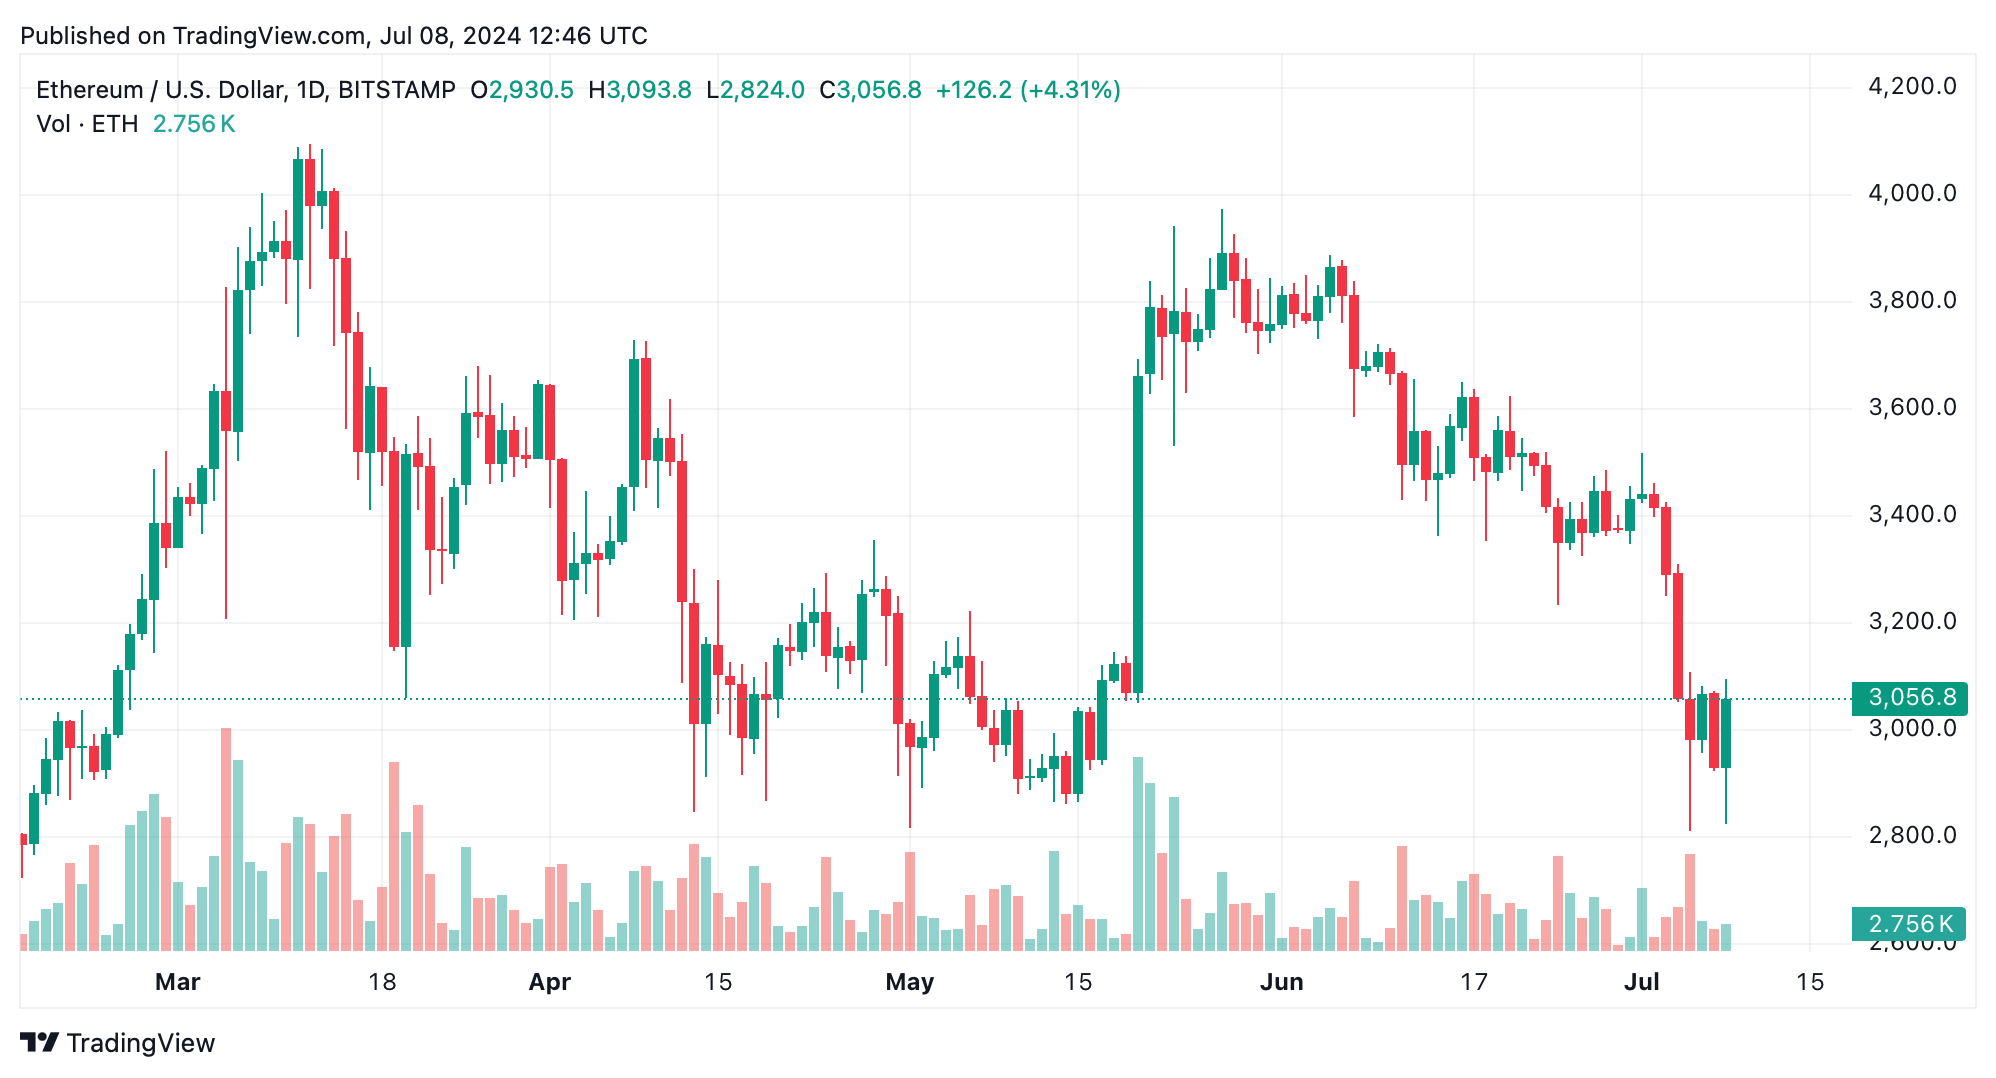
The daily chart shows a clear downtrend over the past month, with ETH falling from around $3,889 to a low of $2,803. The latest upswing shows a potential reversal, suggesting buying interest at lower levels. Volume spikes on the downturns still indicate strong selling pressure, but recent upticks with significant volume suggest buyers are stepping in.
Oscillators present a mixed picture: the relative strength index (RSI) at 35.8 and the average directional index (ADX) at 34.4 are neutral, while the commodity channel index (CCI) at -147.7 and momentum at -331.7 suggest a bullish signal. Conversely, the moving average convergence divergence (MACD) level at -134.4 signals a sell.
Moving averages (MAs) consistently indicate a bearish trend, with all short to long-term moving averages, including the exponential moving averages (EMAs) and simple moving averages (SMAs), signaling bearish sentiment across various timeframes, emphasizing a strong bearish sentiment. Just like bitcoin, ether is suppressed below the long-term 200 MAs.
Bull Verdict:
If ethereum can sustain its price above $3,000 and volume increases, it indicates a potential for a short-term bullish reversal, with targets set at $3,096 and potentially $3,200.
Bear Verdict:
Should ethereum fail to maintain its price above $2,950, it may retest the $2,800 support level. Continued selling pressure below $2,800 could indicate further downside, reinforcing the current bearish trend.
Ethereum (ETH) has experienced notable price movements recently, currently trading at $3,037. The intraday range has fluctuated between $2,803 and $3,096, with a market capitalization standing at $364 billion.
Ethereum
The 1-hour ETH/USD chart reveals a recent uptrend beginning at $2,803, marked by a significant bullish candle reaching $3,096 before a slight pullback. A bullish engulfing pattern indicates a potential continuation of this uptrend, though the last few drops suggest consolidation. Volume analysis shows a spike during the bullish move, but decreasing volume during consolidation suggests that if volume increases, the uptrend may continue.

On the 4-hour ETH/USD chart, ether confirms a downward trend, recently bouncing from the $2,803 low. A strong upswing on July 8 signifies a significant bullish move, potentially indicating a short-term reversal. However, recent candles with small bodies and wicks also highlight indecision. Volume analysis supports this bullish move with higher volume, indicating genuine buying interest.

The daily chart shows a clear downtrend over the past month, with ETH falling from around $3,889 to a low of $2,803. The latest upswing shows a potential reversal, suggesting buying interest at lower levels. Volume spikes on the downturns still indicate strong selling pressure, but recent upticks with significant volume suggest buyers are stepping in.
Oscillators present a mixed picture: the relative strength index (RSI) at 35.8 and the average directional index (ADX) at 34.4 are neutral, while the commodity channel index (CCI) at -147.7 and momentum at -331.7 suggest a bullish signal. Conversely, the moving average convergence divergence (MACD) level at -134.4 signals a sell.
Moving averages (MAs) consistently indicate a bearish trend, with all short to long-term moving averages, including the exponential moving averages (EMAs) and simple moving averages (SMAs), signaling bearish sentiment across various timeframes, emphasizing a strong bearish sentiment. Just like bitcoin, ether is suppressed below the long-term 200 MAs.
Bull Verdict:
If ethereum can sustain its price above $3,000 and volume increases, it indicates a potential for a short-term bullish reversal, with targets set at $3,096 and potentially $3,200.
Bear Verdict:
Should ethereum fail to maintain its price above $2,950, it may retest the $2,800 support level. Continued selling pressure below $2,800 could indicate further downside, reinforcing the current bearish trend.


