The Funding Rate reflects sentiment in the derivatives market. Oftentimes, it gives hints about shifting market moves, with Binance Coin (BNB) becoming the latest cryptocurrency to experience a spike.
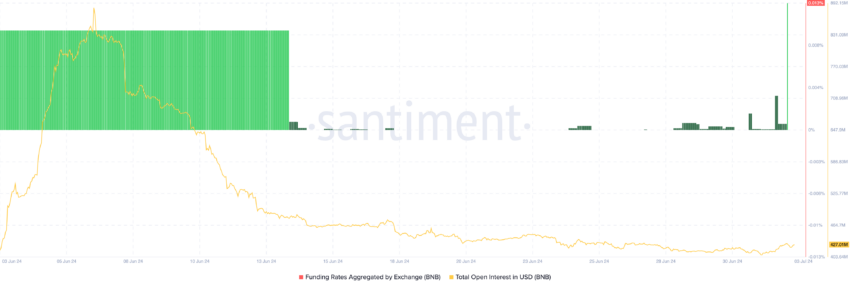
As a key indicator of traders’ positions, the Funding Rate for BNB jumped to 0.013% on July 3. While the reasons behind this deviation remain unclear, here’s how it can impact the price.
Investors Display Confidence in Binance Coin
Typically, the Funding Rate provides a balance between longs and shorts. However, when anomalies like this arise, investors’ behavior shifts toward one side rather than the other.
In simple terms, highly positive funding coincides with boosting confidence in a coin’s price increase. On the other hand, sporadic moves to the negative territory imply bearish.

At press time, BNB’s price is $565.91. Therefore, the rise in the metric mentioned above implies that the perpetual price is currently at a premium to the spot value. Though BNB’s price is a 2.06% decrease in the last 24 hours, the value has risen within the last hour.
If this pattern continues, the reasonable inference is that the coin will continue to rise. Notably, the trend displayed by the Funding Rate is similar to the futures Open Interest (OI), Which is the value of outstanding contracts in the market.
This indicator increases or decreases based on net positioning. If it increases, it implies that traders are adding more liquidity to the market. However, a decrease means that traders are closing existing positions.
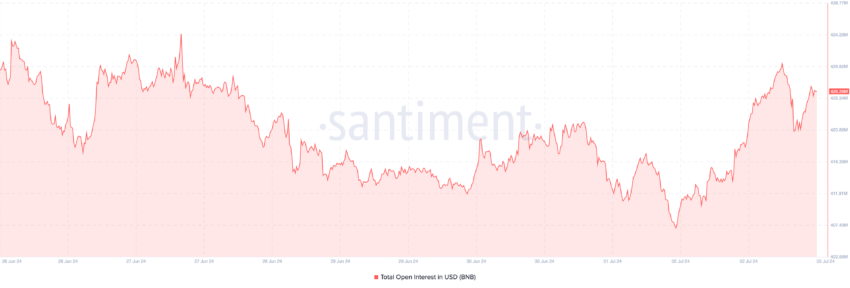
According to Santiment, BNB’s Open Interest had initially dropped to $420.31 million. But as of this writing, the value is $429.29 million, indicating a jump in speculative activity.
Read More: How to Buy BNB and Everything You Need to Know

From a trading perspective, a rise in the OI could back a price increase for the coin as it has done in the past. However, it remains important to consider the cryptocurrency’s potential from a technical angle
BNB Price Prediction: No More Downturn?
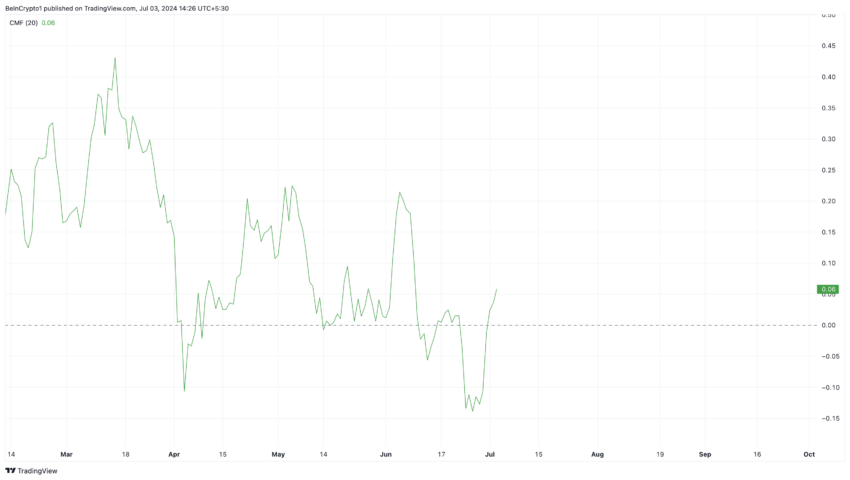
According to the daily chart, BNB may continue to move toward $600. One indicator fueling this narrative is the Chaikin Money Flow (CMF), which differentiates between periods of accumulation and those of distribution.
When the CMF rises, it means accumulation is going on. However, a fall in the indicator’s reading implies that investors are distributing. As of this writing, the CMF is 0.06, indicating that BNB is leaving the distribution zone and may head toward a higher price.

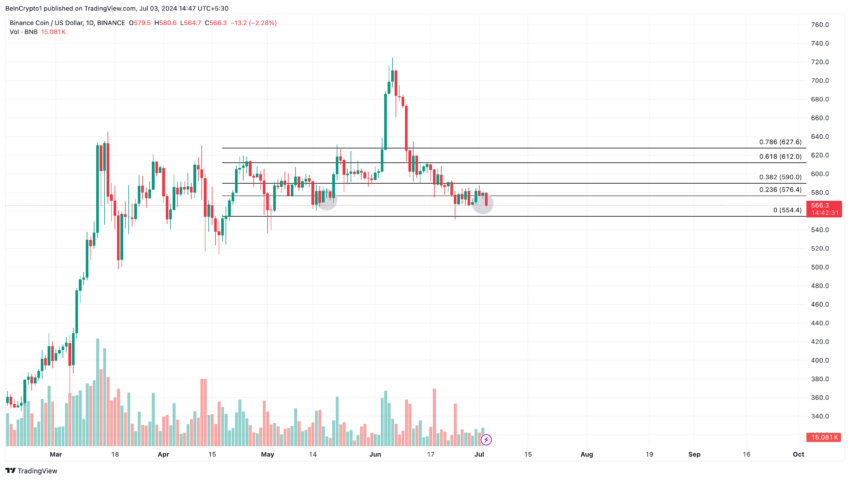
BeInCrypto also examines the Fibonacci Retracement indicator, which spots support and resistance points. As of this writing, BNB seems to have hit a bottom at $566.40. Therefore, increased buying pressure could send the coin to $576.40.
If sustained, the price can reach $590. However, if distribution takes over, this will be invalidated, and the price of BNB may drop to $544.40.

Also, if the Funding Rate increases while the price goes lower, the potential outcome will be a drop toward the underlying support at the aforementioned price.
The Funding Rate reflects sentiment in the derivatives market. Oftentimes, it gives hints about shifting market moves, with Binance Coin (BNB) becoming the latest cryptocurrency to experience a spike.
As a key indicator of traders’ positions, the Funding Rate for BNB jumped to 0.013% on July 3. While the reasons behind this deviation remain unclear, here’s how it can impact the price.
Investors Display Confidence in Binance Coin
Typically, the Funding Rate provides a balance between longs and shorts. However, when anomalies like this arise, investors’ behavior shifts toward one side rather than the other.
In simple terms, highly positive funding coincides with boosting confidence in a coin’s price increase. On the other hand, sporadic moves to the negative territory imply bearish.

At press time, BNB’s price is $565.91. Therefore, the rise in the metric mentioned above implies that the perpetual price is currently at a premium to the spot value. Though BNB’s price is a 2.06% decrease in the last 24 hours, the value has risen within the last hour.
If this pattern continues, the reasonable inference is that the coin will continue to rise. Notably, the trend displayed by the Funding Rate is similar to the futures Open Interest (OI), Which is the value of outstanding contracts in the market.
This indicator increases or decreases based on net positioning. If it increases, it implies that traders are adding more liquidity to the market. However, a decrease means that traders are closing existing positions.
According to Santiment, BNB’s Open Interest had initially dropped to $420.31 million. But as of this writing, the value is $429.29 million, indicating a jump in speculative activity.
Read More: How to Buy BNB and Everything You Need to Know

From a trading perspective, a rise in the OI could back a price increase for the coin as it has done in the past. However, it remains important to consider the cryptocurrency’s potential from a technical angle
BNB Price Prediction: No More Downturn?
According to the daily chart, BNB may continue to move toward $600. One indicator fueling this narrative is the Chaikin Money Flow (CMF), which differentiates between periods of accumulation and those of distribution.
When the CMF rises, it means accumulation is going on. However, a fall in the indicator’s reading implies that investors are distributing. As of this writing, the CMF is 0.06, indicating that BNB is leaving the distribution zone and may head toward a higher price.

BeInCrypto also examines the Fibonacci Retracement indicator, which spots support and resistance points. As of this writing, BNB seems to have hit a bottom at $566.40. Therefore, increased buying pressure could send the coin to $576.40.
If sustained, the price can reach $590. However, if distribution takes over, this will be invalidated, and the price of BNB may drop to $544.40.

Also, if the Funding Rate increases while the price goes lower, the potential outcome will be a drop toward the underlying support at the aforementioned price.


