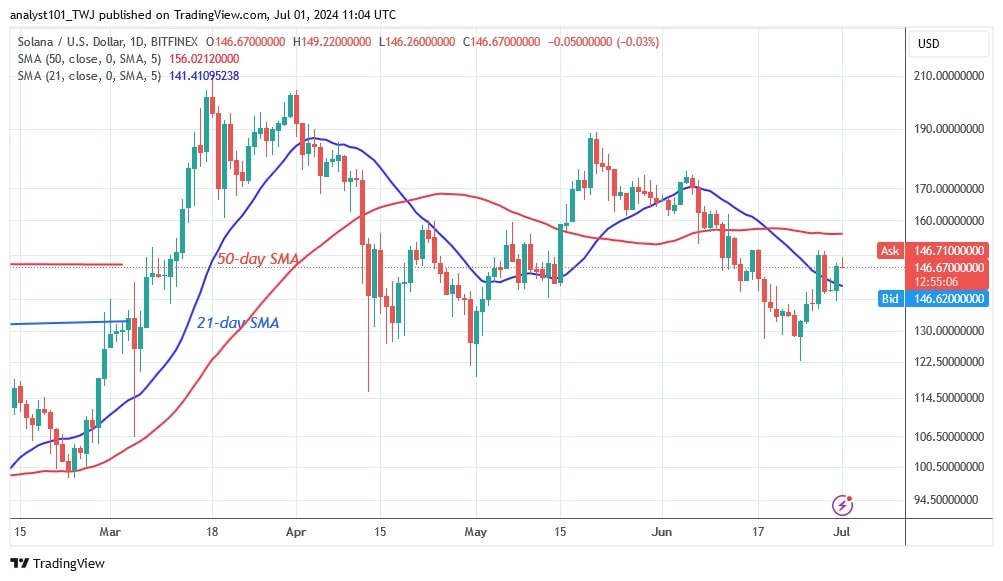
On June 27, the price of Solana (SOL) rallied and rose between the moving average lines. Over the past four days, bulls and bears have been engaged in a price war over the direction of the market.
Long-term forecast for the Solana price: bearish
On June 28, the bears broke through the 21-day SMA, but the bulls bought the dips. The altcoin has recovered above the 21-day SMA support but remains below the 50-day SMA resistance. If the bulls break the 50-day SMA, Solana has all chances to rally and test its previous highs of $175 and $188. If the 21-day SMA support is broken, Solana will fall to lows of $122 and $155.
Analysis of the Solana price indicator
After the recent rally, the price bars are back between the moving averages. The price of Solana will be forced to move between the moving average lines. Currently, the price of the cryptocurrency is at a high of $147.8.
Technical indicators
Important supply zones: $200, $220, $240
Important demand zones: $120, $100, $80

What is the next development for Solana?
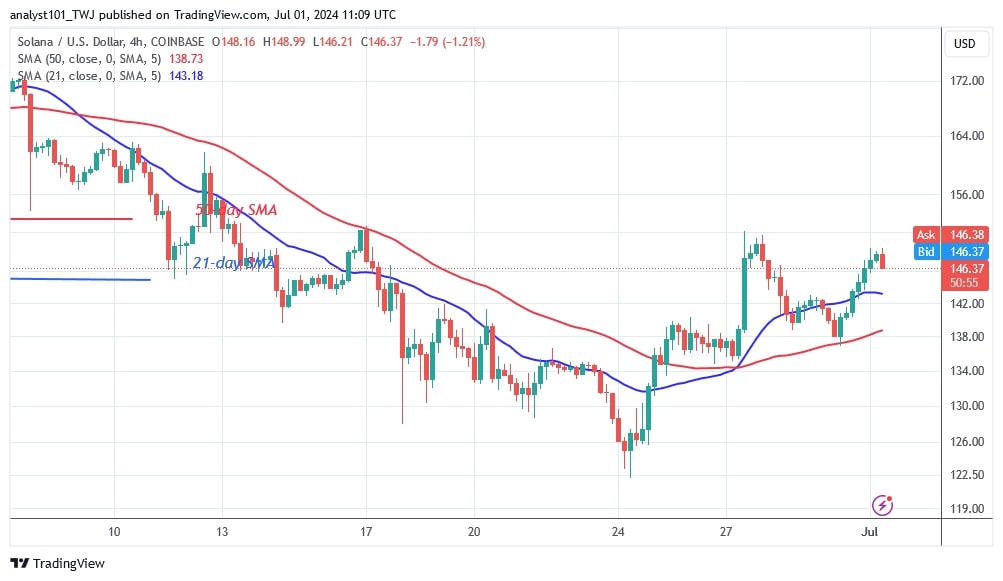
On the 4-hour chart, Solana has rallied after finding support above the $122 level. The altcoin reached a high of $151 before falling back above the moving average lines. The uptrend will resume if the altcoin retraces and finds support above the moving average lines. On the daily chart, the price of the cryptocurrency is trapped between the moving average lines.

Disclaimer. This analysis and forecast are the personal opinions of the author. They are not a recommendation to buy or sell cryptocurrency and should not be viewed as an endorsement by CoinIdol.com. Readers should do their research before investing in funds.


