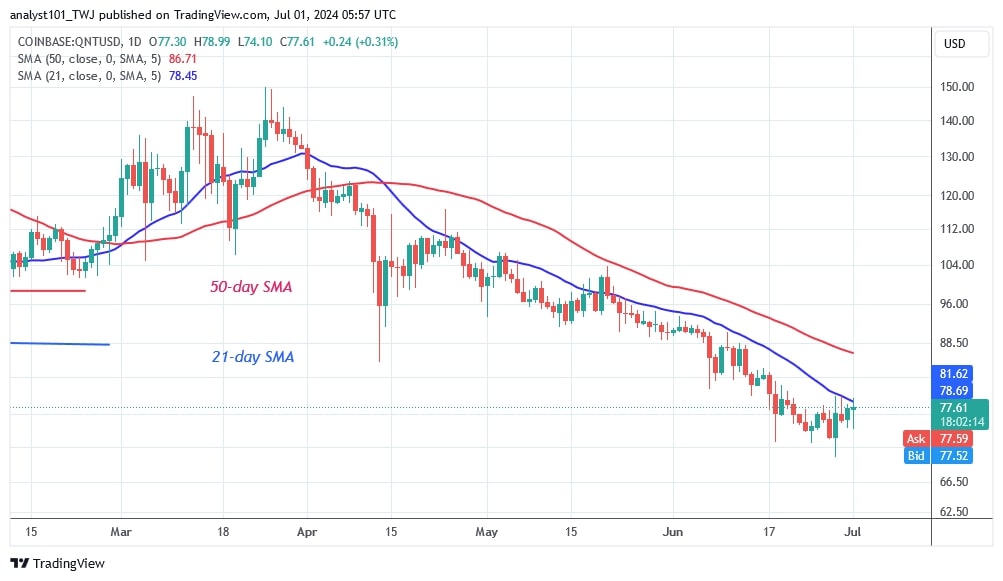
The price of Quant (QNT) is moving in a range between $72 and below the moving average lines.
Long-term Quant price forecast: bearish
Price action has remained steady, with the altcoin fluctuating below the moving average lines. Buyers were rejected on June 28 and today when they attempted to break the 21-day SMA resistance line. If buyers succeed in rising above the moving average lines, selling pressure will ease. A breakout above the moving average lines will catapult the altcoin to a high of $104.
Quant will fall if buyers fail to sustain the price above the moving average lines. The altcoin could fall to $67 if it loses its current support. The altcoin is currently trading at $77.
Analysing the quant price indicators
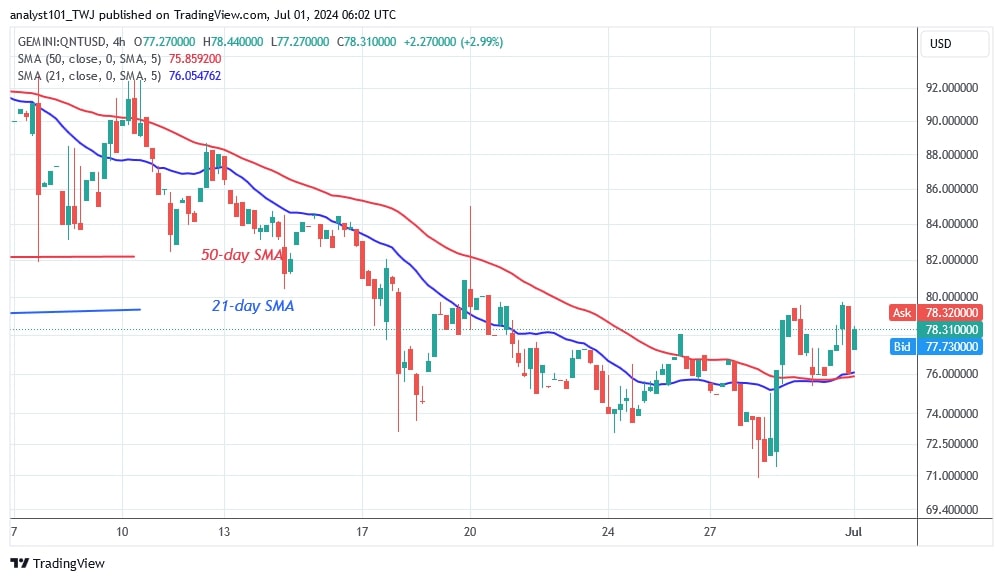
The moving average lines are slipping downwards, but the 21-day SMA is the resistance line for the price bars. If the moving averages are broken, the trend will change. On the 4-hour chart, the price bars are above the moving average lines, but the upward movement is limited by the resistance at $80.
Technical indicators
Important supply zones: $140, $150, $160
Important demand zones: $90, $80, $70

What’s next for Quant?
The current decline has weakened since the price drop on June 18. On the 4-hour chart, the price of the altcoin is fluctuating between $71 and $80. The altcoin is trading above the moving average lines and is again testing the barrier at $80. At $80 and above, it is more difficult for buyers to enter the market.

Coinidol.com reported that Quant was traded between $72 and $78 last week. On June 20, the altcoin rallied and broke out above the moving average lines but was rejected at a high of $85.
Disclaimer. This analysis and forecast are the personal opinions of the author. They are not a recommendation to buy or sell cryptocurrency and should not be viewed as an endorsement by CoinIdol.com. Readers should do their research before investing in funds.


