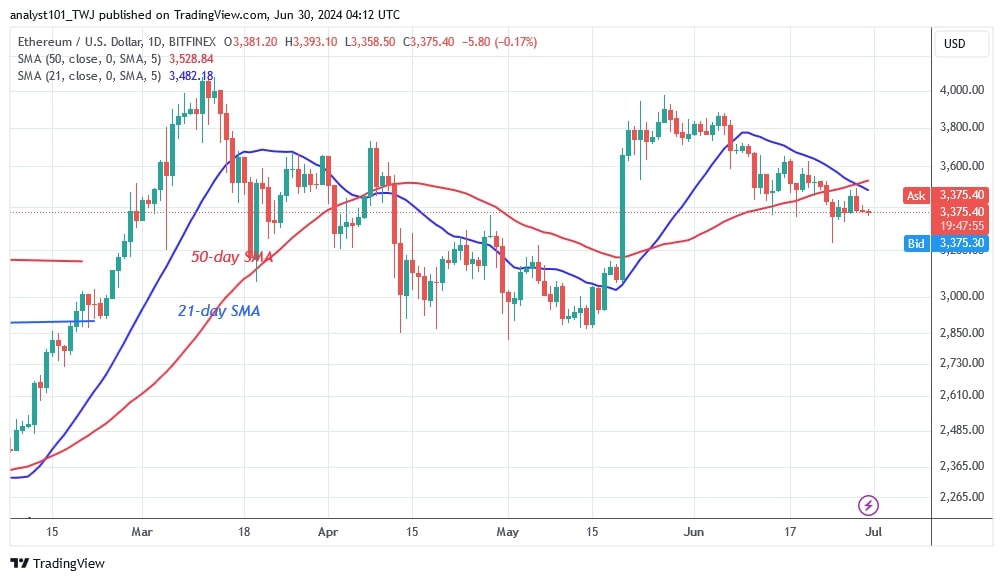
The price of Ethereum (ETH) has been consolidating above the $3,300 support but below the moving average lines since the price dip on June 24.
Long-term analysis of the Ethereum price: bearish
Today, the largest altcoin is facing a rejection at the moving average lines as buyers try to keep the price above these lines.
Should the buyers succeed, Ether will reach a high of $3,730. However, the price signal suggests that the cryptocurrency could fall further. On the downside, if Ether loses its current support at $3,200, Ethereum will depreciate above the $3,000 support. Ether is currently valued at $3,490.
Analysis of the Ethereum indicators
After the price recovery, the price bars are partly between the moving average lines. The largest altcoin could continue its slide below the moving average lines. However, Ethereum is expected to decline due to the rejection at the moving average lines.
Technical indicators:
Key resistance levels – $4,000 and $4,500
Key support levels – $3,500 and $3,000

What is the next direction for Ethereum?
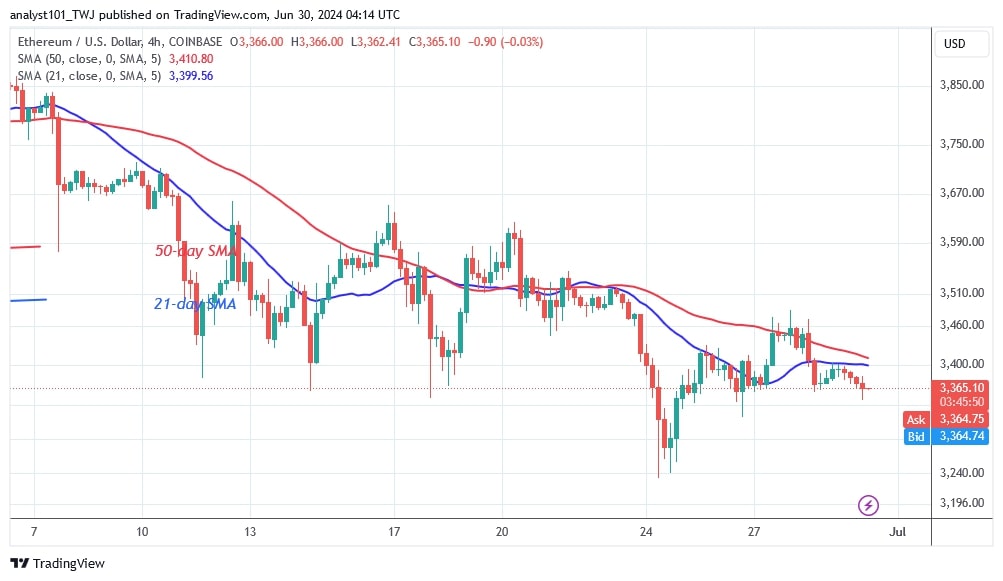
On the 4-hour chart, Ether is still in a sideways trend after the price drop on June 24. The upward movement was halted at the $3,510 resistance level.
On the downside, the decline was halted at $3,240. If the current support level is breached, selling pressure will increase again.
Ether was trading above $3,200 and below the moving average lines, as Coinidol.com reported last week. On June 27, buyers tried to push the price above the moving average lines but failed to do so.

Disclaimer. This analysis and forecast are the personal opinions of the author and are not a recommendation to buy or sell cryptocurrency and should not be viewed as an endorsement by CoinIdol.com. Readers should do their research before investing in funds.


