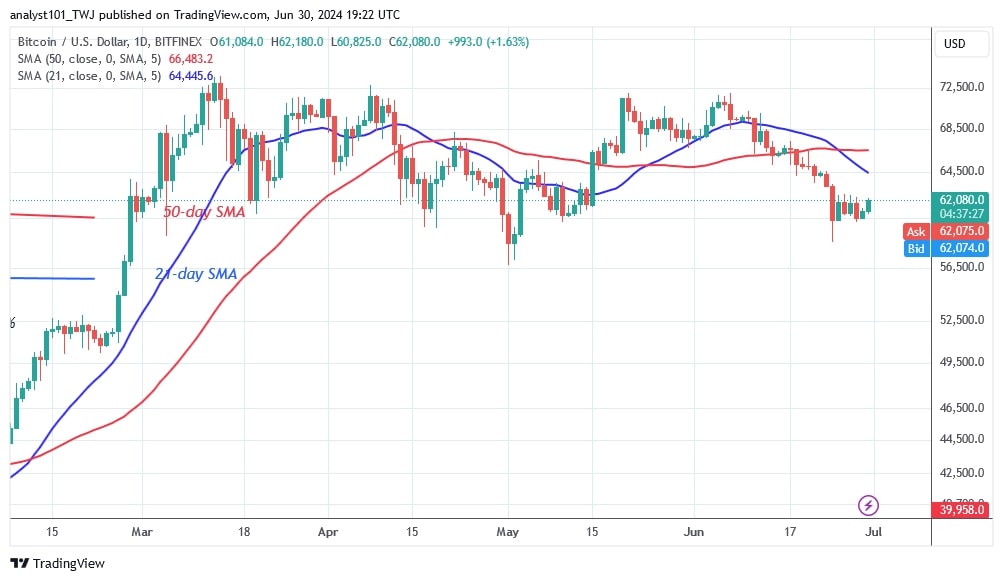
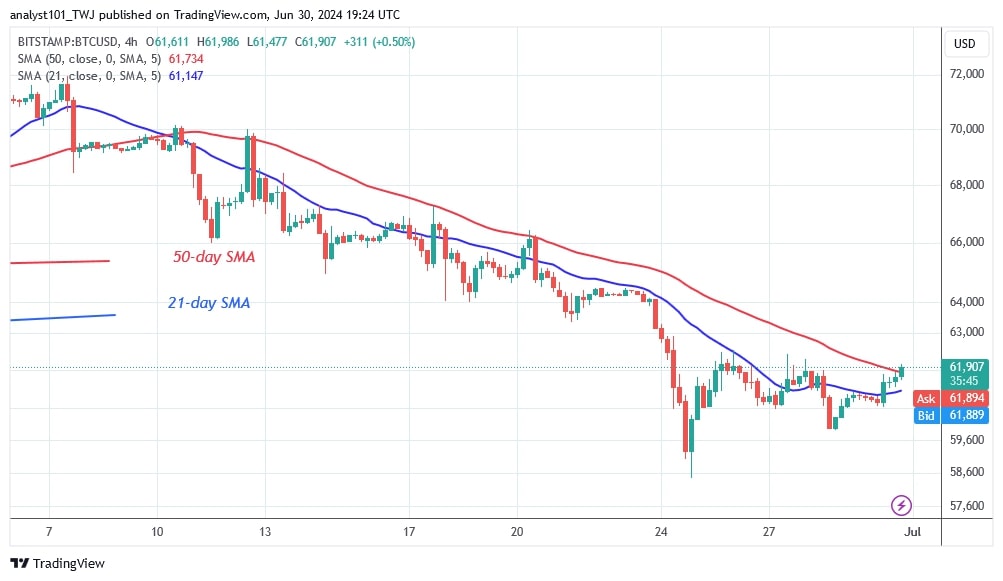
The price of Bitcoin (BTC) fell to $58,555 on June 24, but the bulls bought the dips.
Long-term forecast for the Bitcoin price: bearish
The price pulled back above the psychological $60,000 mark and continued its fluctuating trend. Today, the BTC price has recovered and broken out of the current price range of $60,000 to $63,000.
On the upside, Bitcoin will encounter resistance near the moving average line. A break above the moving average lines would propel Bitcoin to a high of $70,000. On the other hand, if Bitcoin fails to break above the moving average lines, it will be forced to continue its move above the $60,000 support but below the moving average lines. At the time of writing, Bitcoin is currently worth $63,622.
Bitcoin indicator reading
After the recent price rise, as reported by Coinidol.com previously, the BTC price is above the moving average lines on the 4-hour chart. Bitcoin has resumed its uptrend. On the upside, the uptrend is rejected at the 21-day SMA. Despite the price recovery, the moving average lines remain flat.
Technical indicators:
Key resistance levels – $70,000 and $80,000
Key support levels – $50,000 and $40,000

What is the next direction for BTC/USD?
Bitcoin has resumed its uptrend, although it remains in the downtrend zone. The largest cryptocurrency is facing a rejection at the 21-day SMA or resistance at $64,000. The cryptocurrency is expected to continue its move above $60,000 but below the moving averages.

Disclaimer. This analysis and forecast are the personal opinions of the author and are not a recommendation to buy or sell cryptocurrency and should not be viewed as an endorsement by CoinIdol.com. Readers should do their research before investing in funds.


