A closely followed crypto analyst says one Bitcoin (BTC) indicator is flashing green despite the Monday correction below $60,000.
Pseudonymous analyst TechDev tells his 460,100 followers on the social media platform X that a key indicator is suggesting Bitcoin may soon go parabolic.
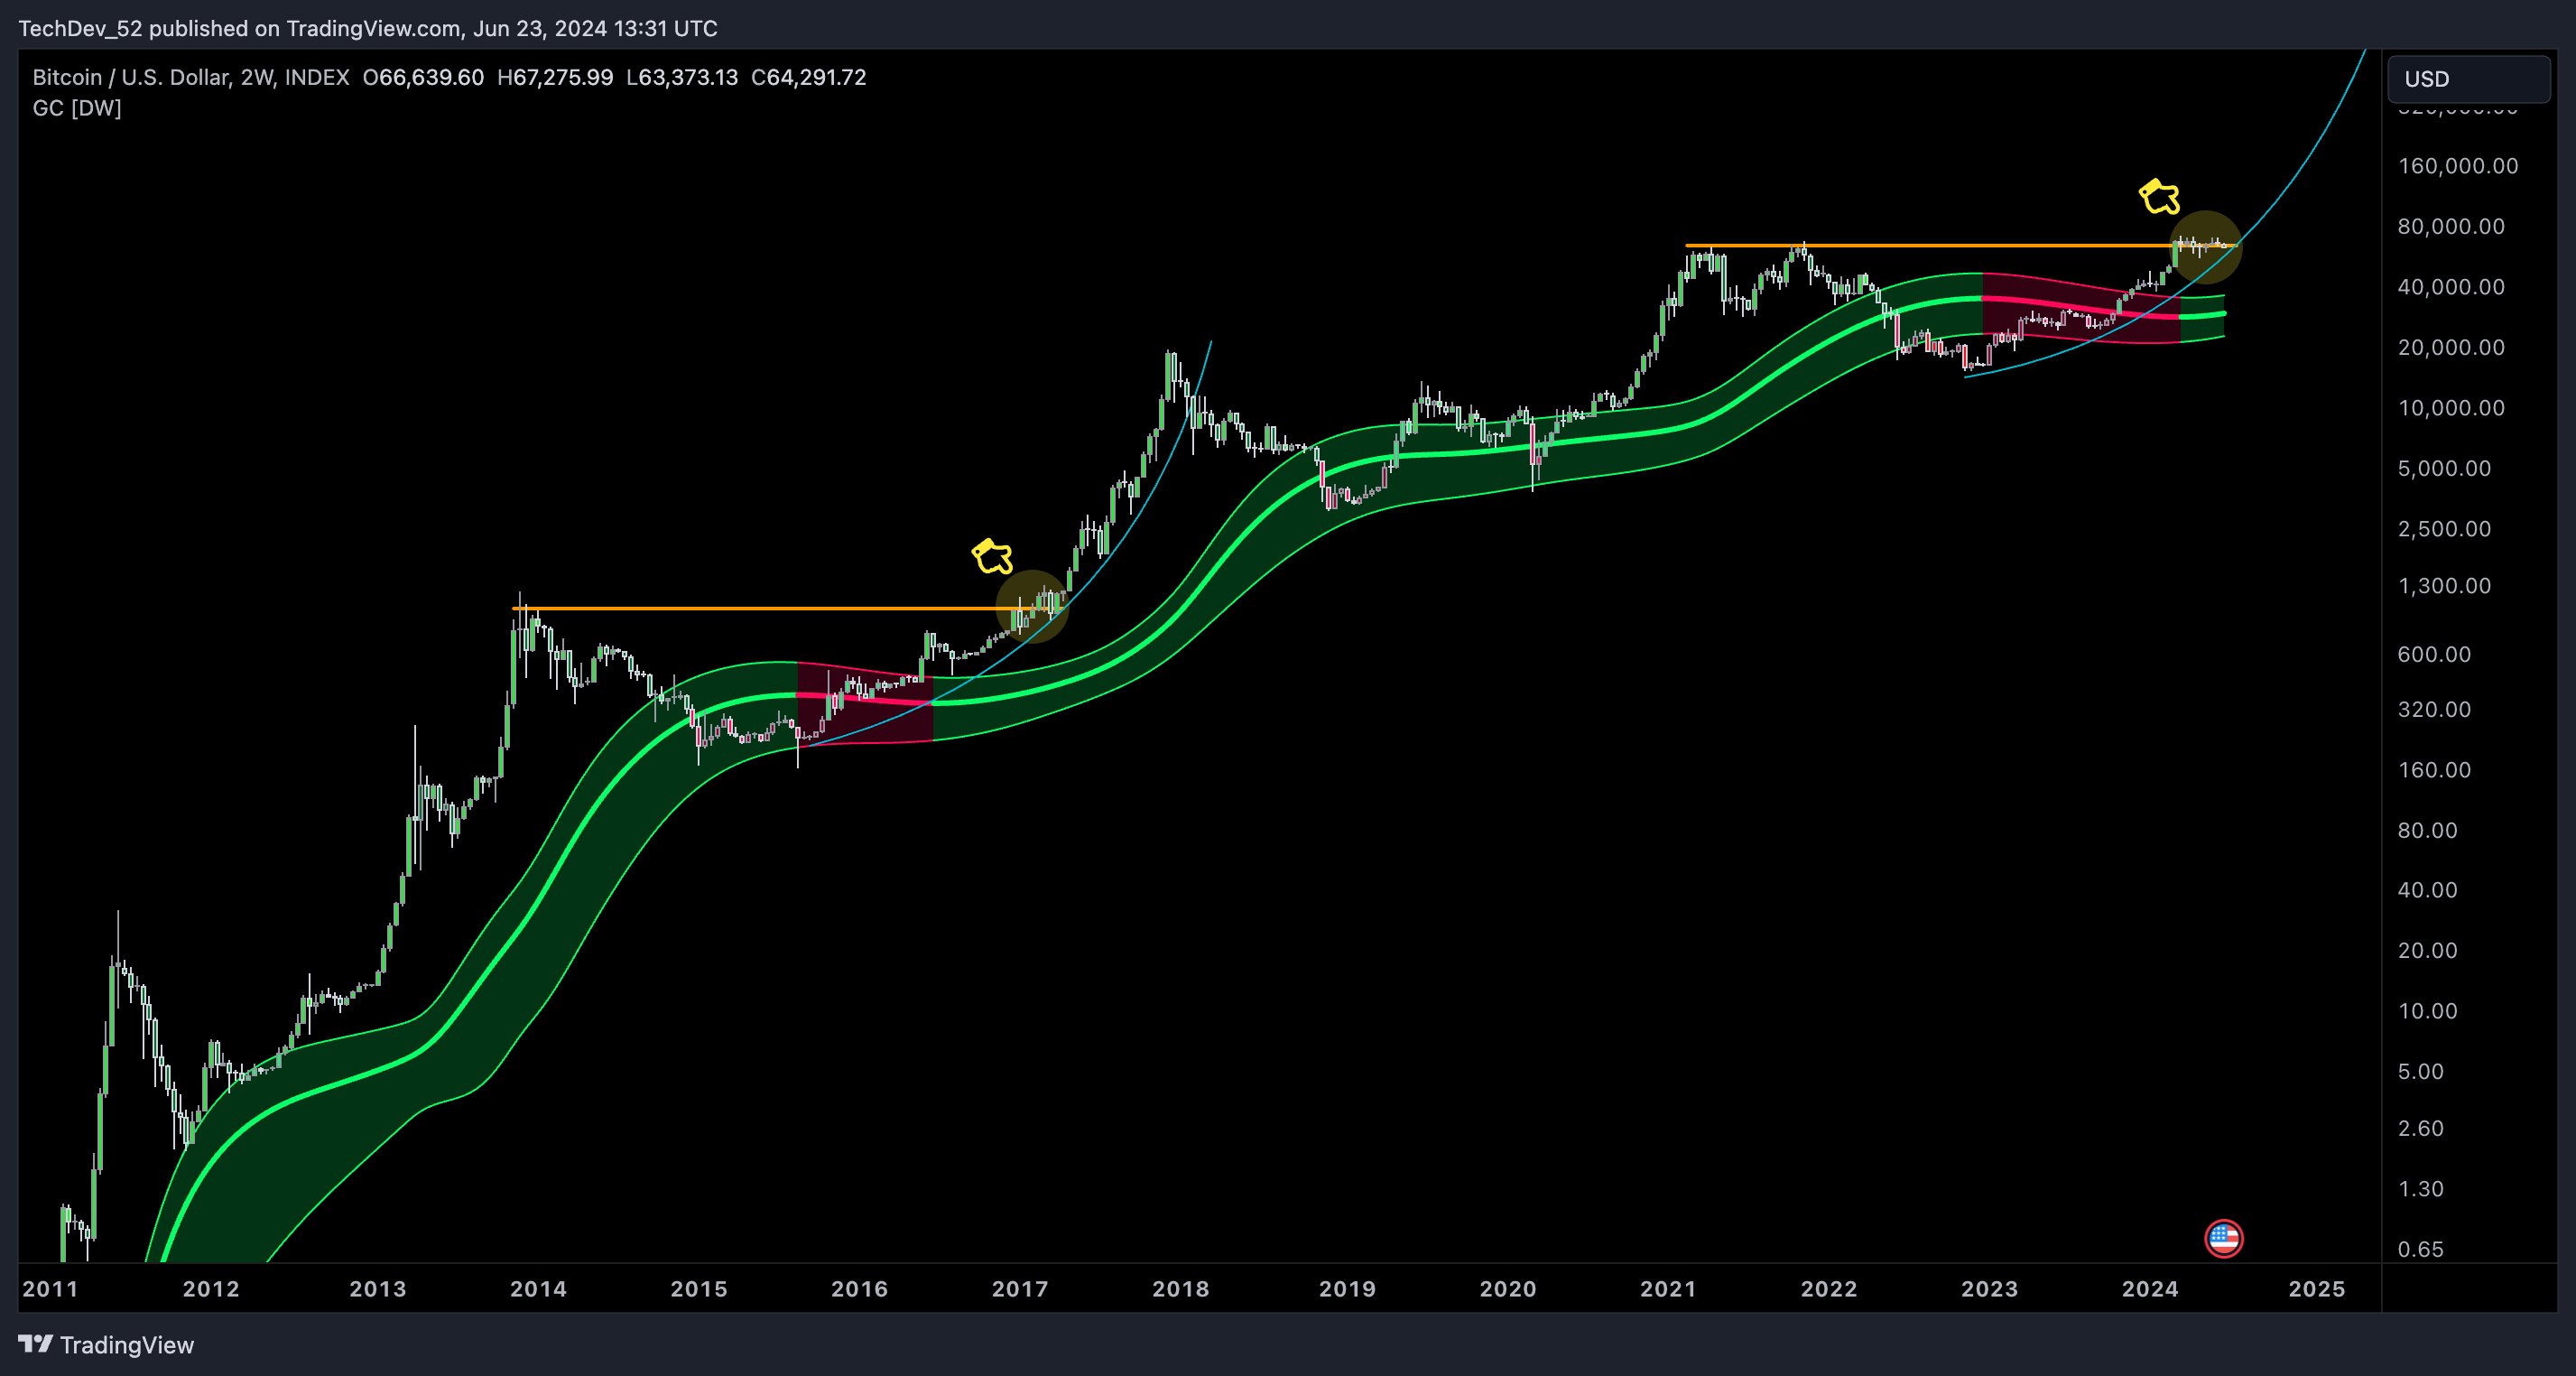
“There’s only one other time in Bitcoin history when the two-week Gaussian channel flipped green. Price consolidating at the prior high marked the halfway point of a parabolic move few saw coming.”

Gaussian channels are momentum indicators that can be used to identify price tops and bottoms. Looking at his two-week chart, the analyst suggests that Bitcoin is forming a similar pattern in 2017 that led to a massive rally.
Next, the analyst explores the Chaikin Money Flow (CMF), a metric measuring the volume-weighted average of accumulation and distribution over a set period.
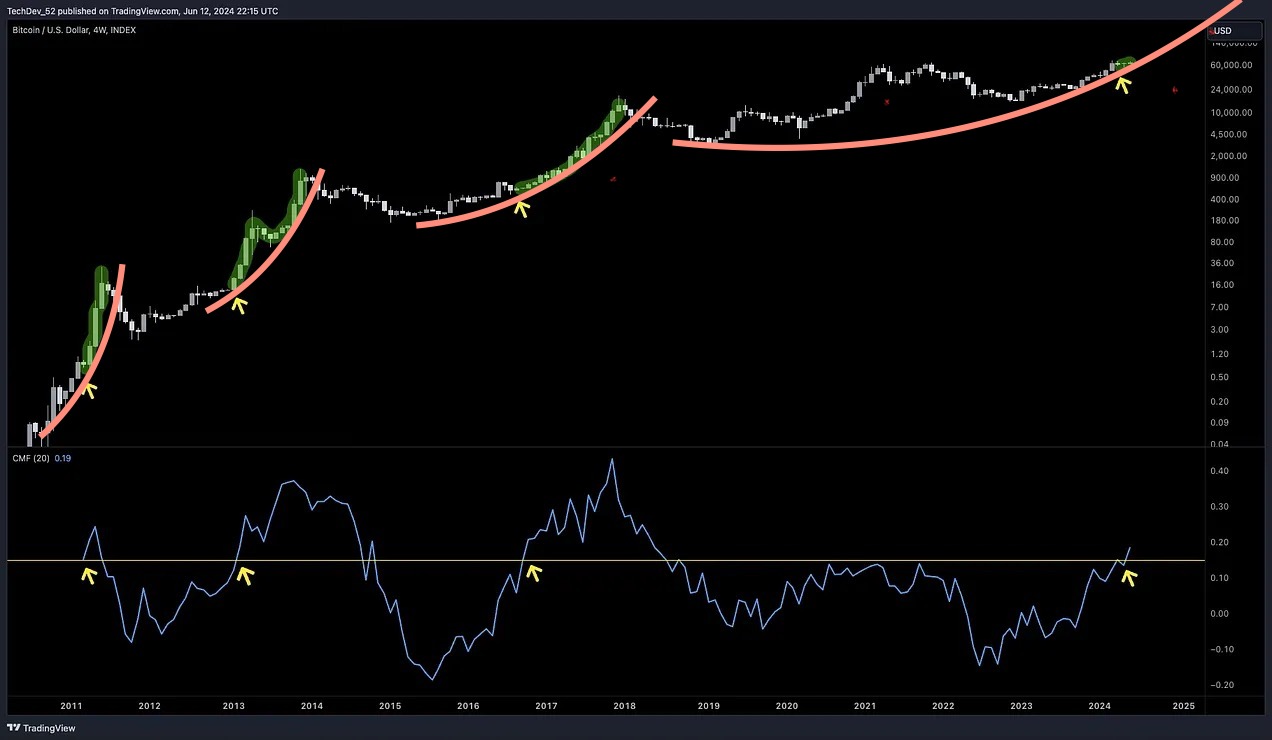
Using the CMF metric, the analyst highlights that Bitcoin is above the bullish line for the fourth time on the four-week chart.
TechDev shares a chart showing that BTC was also above the same line in late 2016, early 2013 and early 2011 –just before Bitcoin ignited parabolic moves.
“First four-week parabolic money flow signal on Bitcoin since 2017…
The idea of ‘lengthening cycles’ got abandoned due to some arbitrary definition of cycles. By another, it never left. But none of it really matters. BTC’s been in an uptrend since its birth, and the same signal which called the other three blowoff moves is firing again.”

Bitcoin is trading for $60,586 at time of writing, down 4.6% in the last 24 hours.
Generated Image: DALLE3
A closely followed crypto analyst says one Bitcoin (BTC) indicator is flashing green despite the Monday correction below $60,000.
Pseudonymous analyst TechDev tells his 460,100 followers on the social media platform X that a key indicator is suggesting Bitcoin may soon go parabolic.
“There’s only one other time in Bitcoin history when the two-week Gaussian channel flipped green. Price consolidating at the prior high marked the halfway point of a parabolic move few saw coming.”

Gaussian channels are momentum indicators that can be used to identify price tops and bottoms. Looking at his two-week chart, the analyst suggests that Bitcoin is forming a similar pattern in 2017 that led to a massive rally.
Next, the analyst explores the Chaikin Money Flow (CMF), a metric measuring the volume-weighted average of accumulation and distribution over a set period.
Using the CMF metric, the analyst highlights that Bitcoin is above the bullish line for the fourth time on the four-week chart.
TechDev shares a chart showing that BTC was also above the same line in late 2016, early 2013 and early 2011 –just before Bitcoin ignited parabolic moves.
“First four-week parabolic money flow signal on Bitcoin since 2017…
The idea of ‘lengthening cycles’ got abandoned due to some arbitrary definition of cycles. By another, it never left. But none of it really matters. BTC’s been in an uptrend since its birth, and the same signal which called the other three blowoff moves is firing again.”

Bitcoin is trading for $60,586 at time of writing, down 4.6% in the last 24 hours.
Generated Image: DALLE3


