Ethereum’s price stands at $3,311, with a market capitalization of $404 billion. The 24-hour intraday trading range has fluctuated between $3,277 and $3,500, while the 24-hour trade volume has reached $16.82 billion. A technical analysis across various timeframes highlights significant bearish indicators. The confluence of oscillators and moving averages suggest a continuation of the downward trajectory unless strong buying interest emerges.
Ethereum
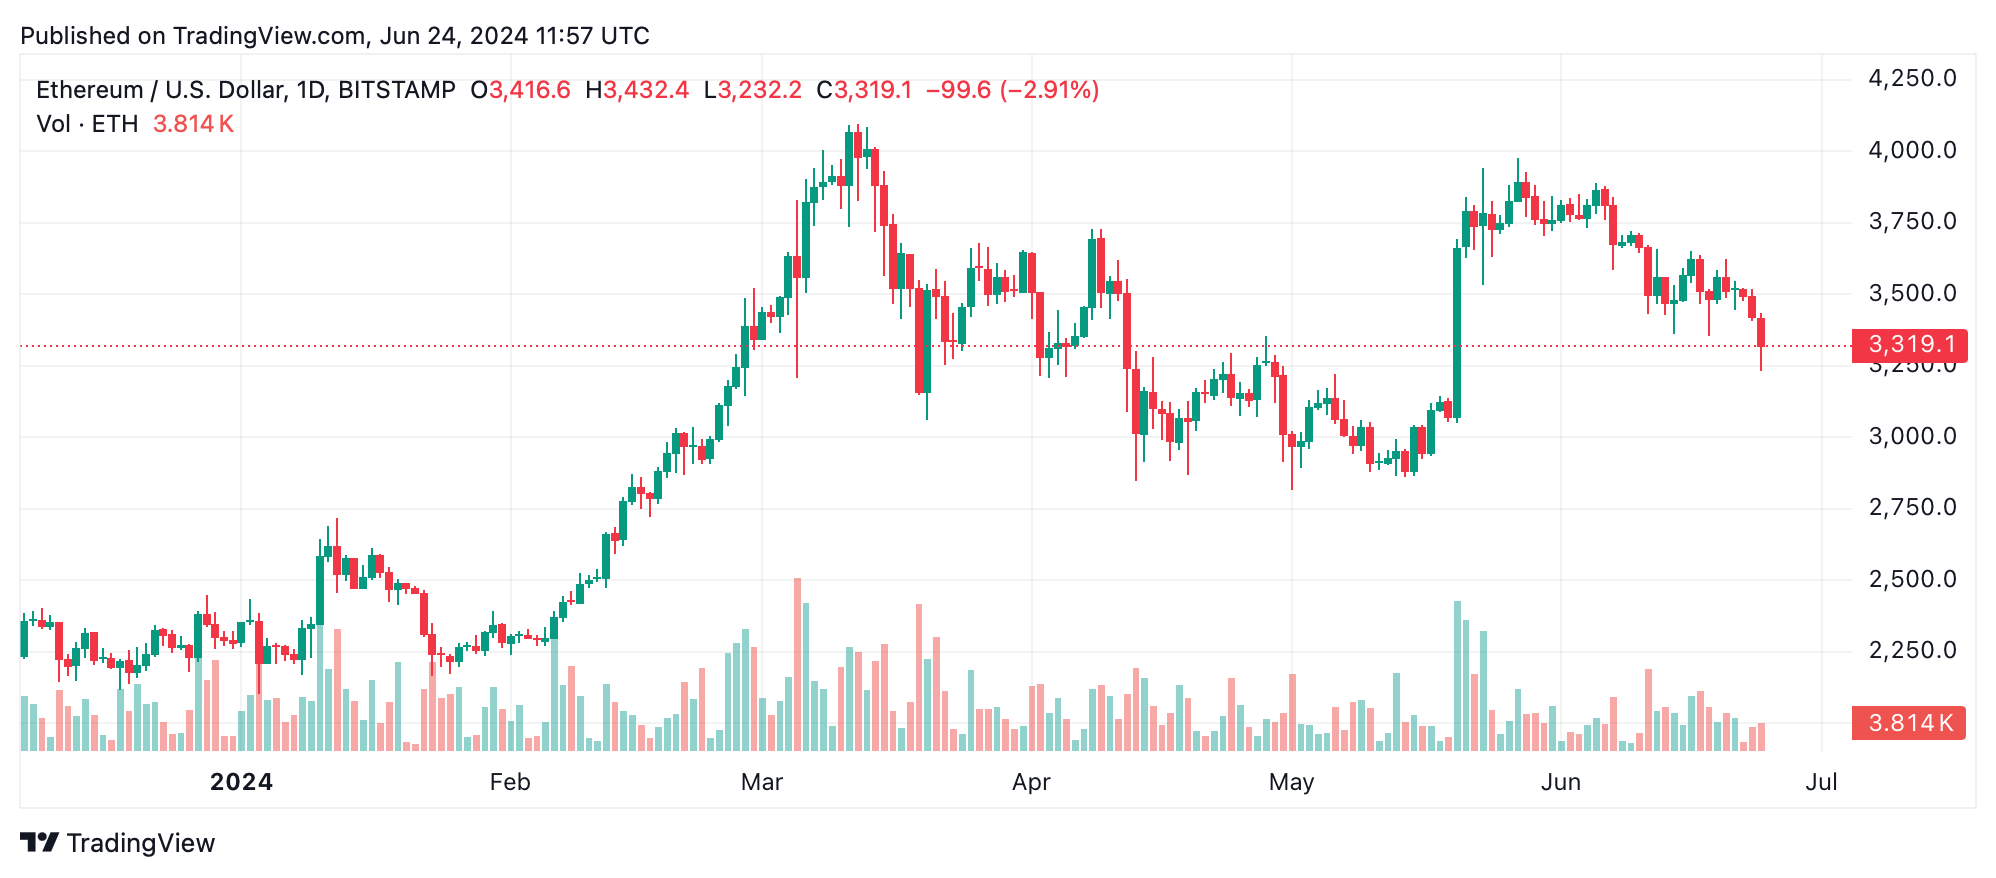
Ethereum’s daily chart reveals a pronounced downtrend, with the price peaking at $3,980 and consistently forming lower highs and lower lows. Recent trading sessions show a sharp decline, closing at $3,225, accompanied by a significant increase in volume. This surge in trading activity underscores the strong selling pressure currently dominating the market.

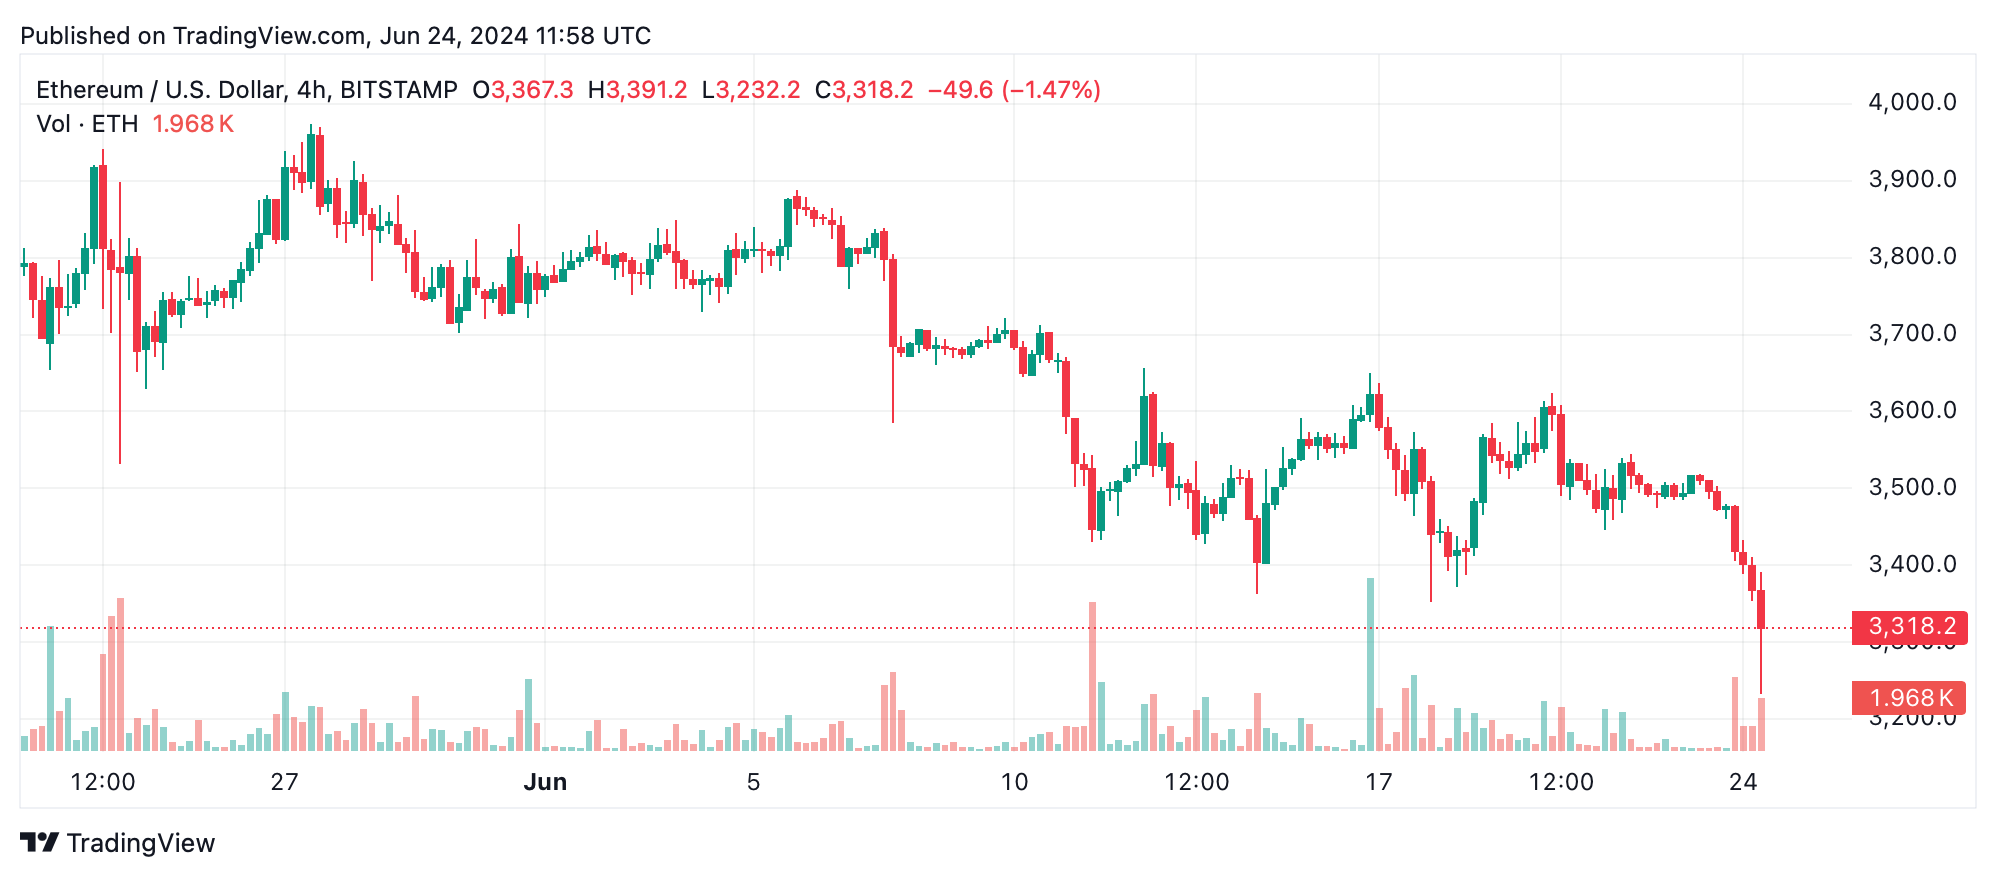
The 4-hour chart reinforces this bearish outlook, with the price declining steadily after reaching a high of $3,628 per unit. The breach of key support levels around $3,350 and the subsequent dip to $3,225 highlights the intensity of the downward momentum. The increased volume during these declines further suggests strong bearish sentiment among traders.

On the hourly chart, the downtrend is more granular, showing a sharp drop to $3,225 followed by a period of consolidation. The attempted bounce after hitting this low faced resistance indicates a potential short-term reversal. The spike in volume during the significant drop aligns with the bearish momentum observed on longer timeframes.
Oscillator readings further validate the bearish outlook. The relative strength index (RSI) at 36.4, Stochastic at 25.1, and commodity channel index (CCI) at -160.9 all indicate neutral positions, suggesting neither overbought nor oversold conditions. However, the awesome oscillator, momentum, and moving average convergence divergence (MACD) all point to sell signals, reinforcing the prevailing bearish sentiment.
Moving averages (MAs) across various periods predominantly signal selling dominance. Short-term and mid-term exponential moving averages (EMAs) and simple moving averages (SMAs) are all aligned with the sell indication. Only the long-term 200-day EMAs and SMAs signal a buy, suggesting potential support at lower levels, but the overall trend remains bearish.
Bear Verdict:
Ethereum’s technical indicators across daily, 4-hour, and hourly charts point to continued bearish momentum. Oscillators and moving averages predominantly suggest selling, reinforcing the downtrend narrative. Traders should exercise caution and consider potential further declines unless significant buying pressure materializes to alter the current market dynamics.
Bull Verdict:
Despite the prevailing bearish signals, the long-term 200-day moving averages suggest potential support around lower levels, indicating a possible buying opportunity if the market sentiment shifts. Investors looking for a long-term entry point might consider this level for potential accumulation, anticipating a reversal in the broader trend.
Ethereum’s price stands at $3,311, with a market capitalization of $404 billion. The 24-hour intraday trading range has fluctuated between $3,277 and $3,500, while the 24-hour trade volume has reached $16.82 billion. A technical analysis across various timeframes highlights significant bearish indicators. The confluence of oscillators and moving averages suggest a continuation of the downward trajectory unless strong buying interest emerges.
Ethereum
Ethereum’s daily chart reveals a pronounced downtrend, with the price peaking at $3,980 and consistently forming lower highs and lower lows. Recent trading sessions show a sharp decline, closing at $3,225, accompanied by a significant increase in volume. This surge in trading activity underscores the strong selling pressure currently dominating the market.

The 4-hour chart reinforces this bearish outlook, with the price declining steadily after reaching a high of $3,628 per unit. The breach of key support levels around $3,350 and the subsequent dip to $3,225 highlights the intensity of the downward momentum. The increased volume during these declines further suggests strong bearish sentiment among traders.

On the hourly chart, the downtrend is more granular, showing a sharp drop to $3,225 followed by a period of consolidation. The attempted bounce after hitting this low faced resistance indicates a potential short-term reversal. The spike in volume during the significant drop aligns with the bearish momentum observed on longer timeframes.
Oscillator readings further validate the bearish outlook. The relative strength index (RSI) at 36.4, Stochastic at 25.1, and commodity channel index (CCI) at -160.9 all indicate neutral positions, suggesting neither overbought nor oversold conditions. However, the awesome oscillator, momentum, and moving average convergence divergence (MACD) all point to sell signals, reinforcing the prevailing bearish sentiment.
Moving averages (MAs) across various periods predominantly signal selling dominance. Short-term and mid-term exponential moving averages (EMAs) and simple moving averages (SMAs) are all aligned with the sell indication. Only the long-term 200-day EMAs and SMAs signal a buy, suggesting potential support at lower levels, but the overall trend remains bearish.
Bear Verdict:
Ethereum’s technical indicators across daily, 4-hour, and hourly charts point to continued bearish momentum. Oscillators and moving averages predominantly suggest selling, reinforcing the downtrend narrative. Traders should exercise caution and consider potential further declines unless significant buying pressure materializes to alter the current market dynamics.
Bull Verdict:
Despite the prevailing bearish signals, the long-term 200-day moving averages suggest potential support around lower levels, indicating a possible buying opportunity if the market sentiment shifts. Investors looking for a long-term entry point might consider this level for potential accumulation, anticipating a reversal in the broader trend.


