Bitcoin’s price has dropped rapidly over the last few days after failing to keep above the $70K level. The market is currently approaching a fundamental level.
Bitcoin Price Analysis: Technicals
By TradingRage
The Daily Chart
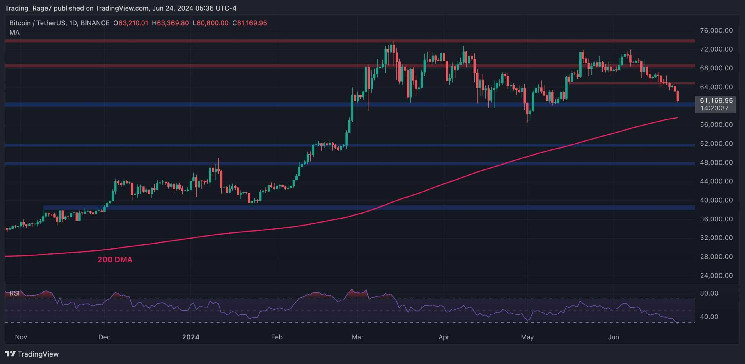
As the daily timeframe demonstrates, the BTC price has been trending downward since the beginning of June following a rejection from the $72K zone. The price is approaching the pivotal $60K support level.
With the 200-day moving average around the $58K mark, a break below $60K could lead to a retest of the moving average. Overall, the market’s mid-term fate relies on the price’s reaction to these support elements.

The 4-Hour Chart
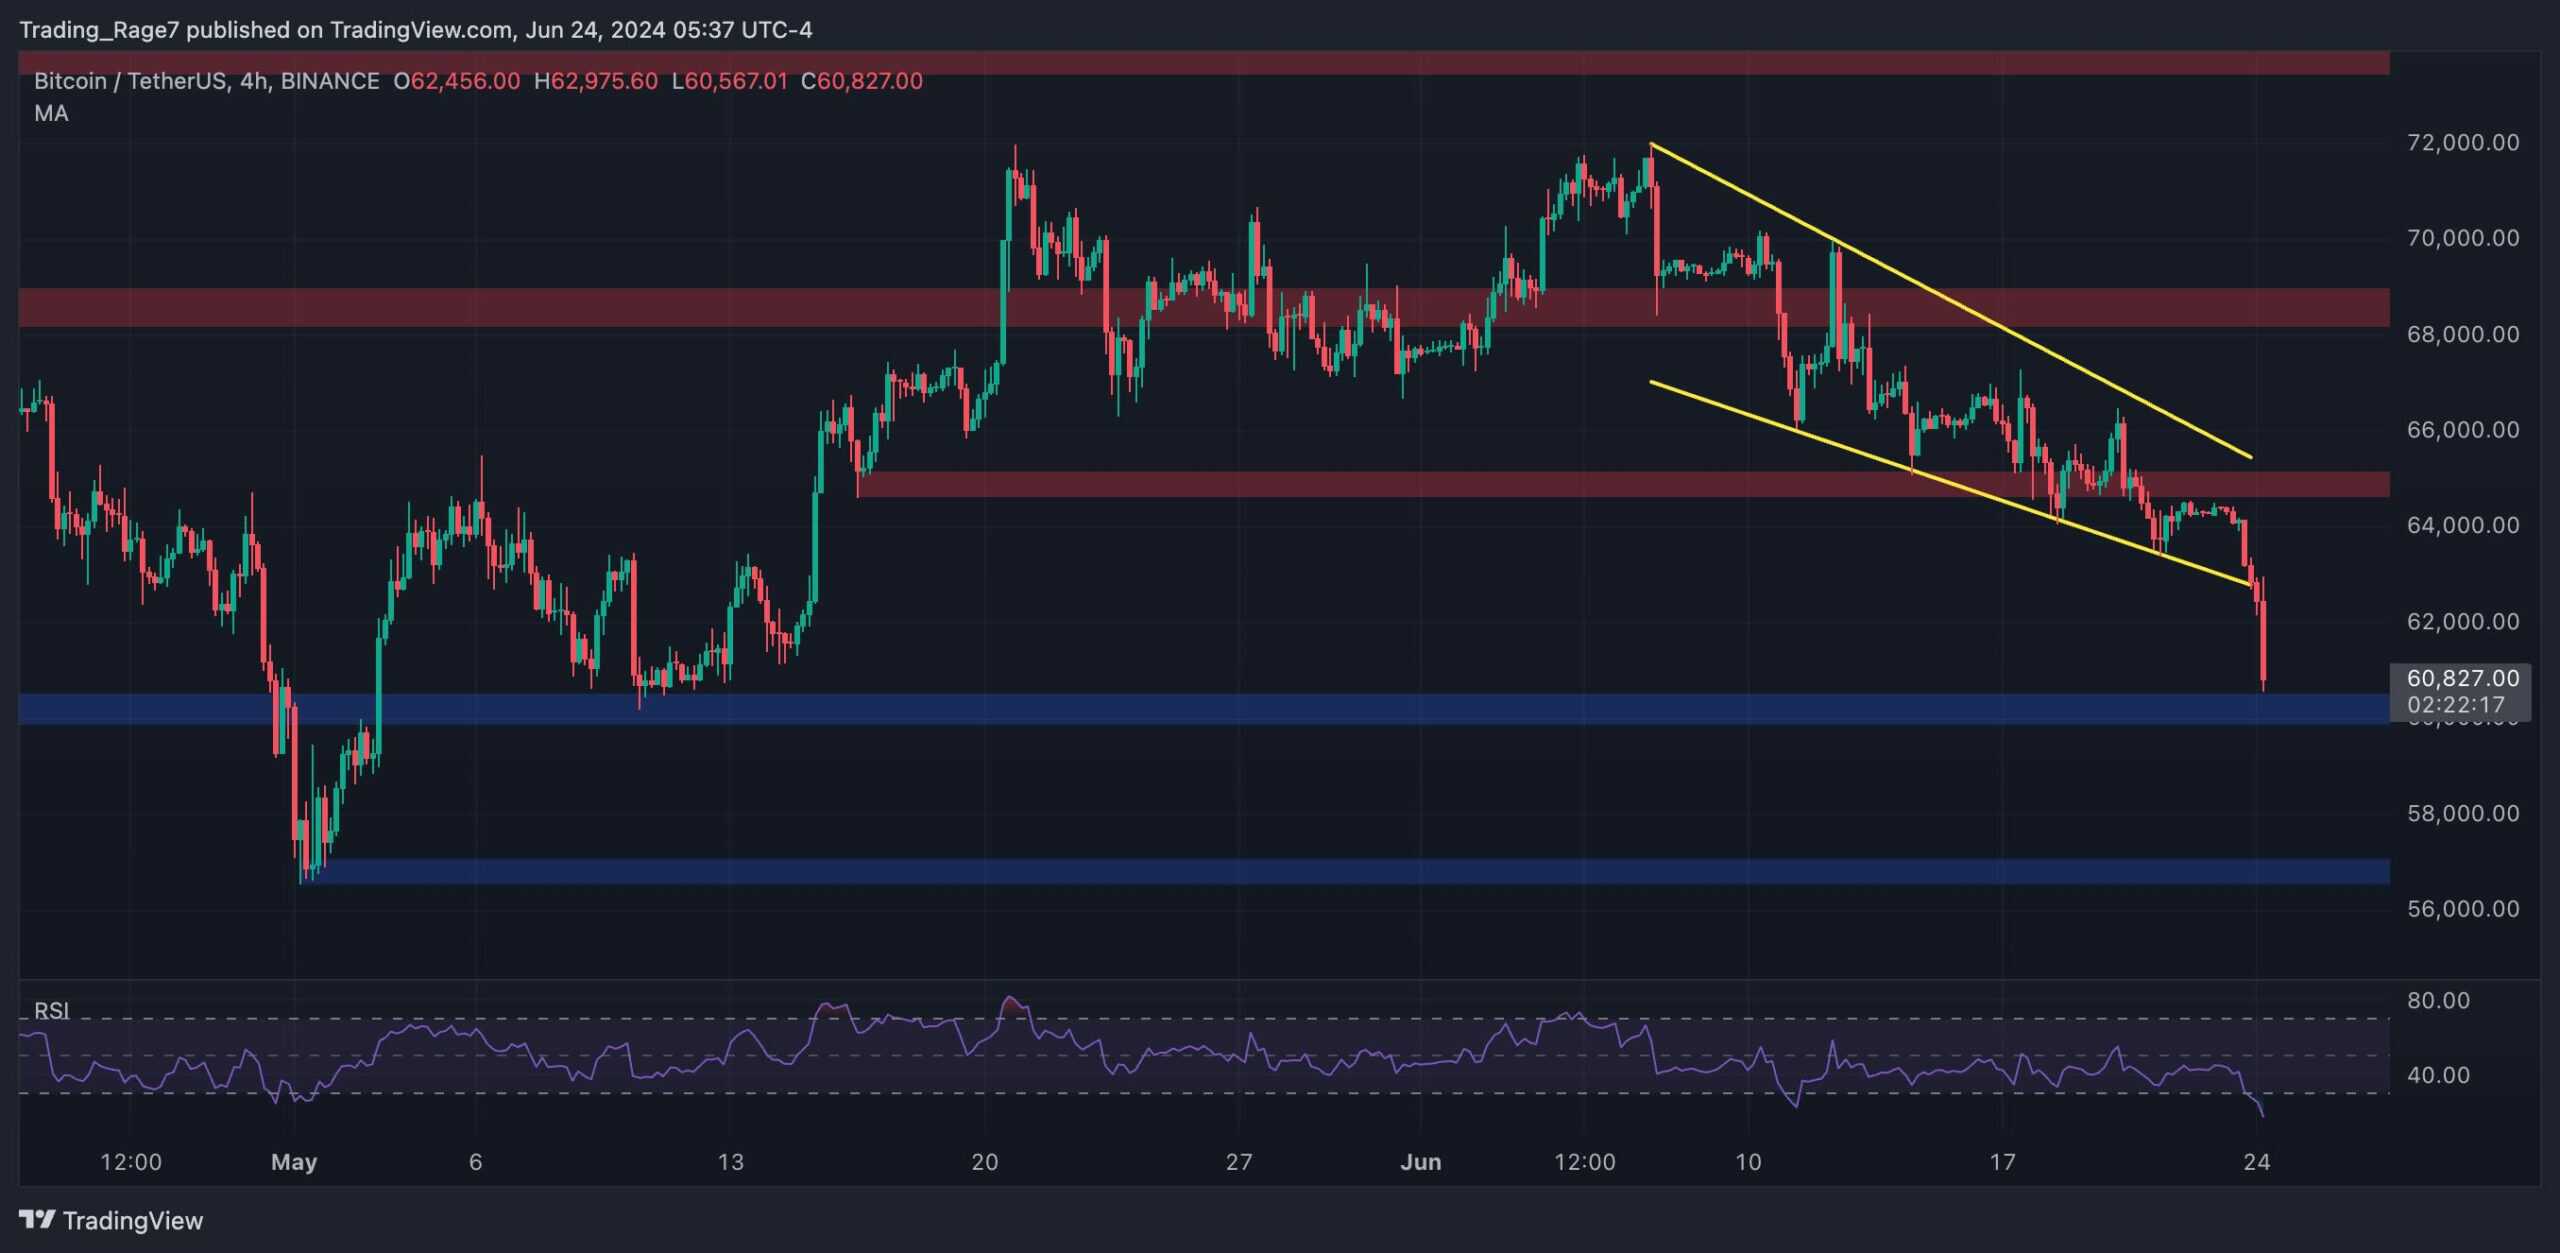
On the 4-hour chart, the large falling wedge pattern has finally been broken to the downside, and the price is aggressively approaching the $60K support zone. The Relative Strength Index has also declined rapidly and is showing values below 30% at the moment.
Therefore, BTC is currently oversold on the 4-hour timeframe, and a short-term rebound or consolidation at the $60K level is probable.
Yet, if the market breaks lower, the $58K support zone would be the next potential target.

On-Chain Analysis
By TradingRage
Bitcoin Short-Term Holder SOPR
While Bitcoin’s price has decreased recently, many market participants are seeing their unrealized profits shrink. Meanwhile, some holders have realized their profits and exited the market before going into a loss.
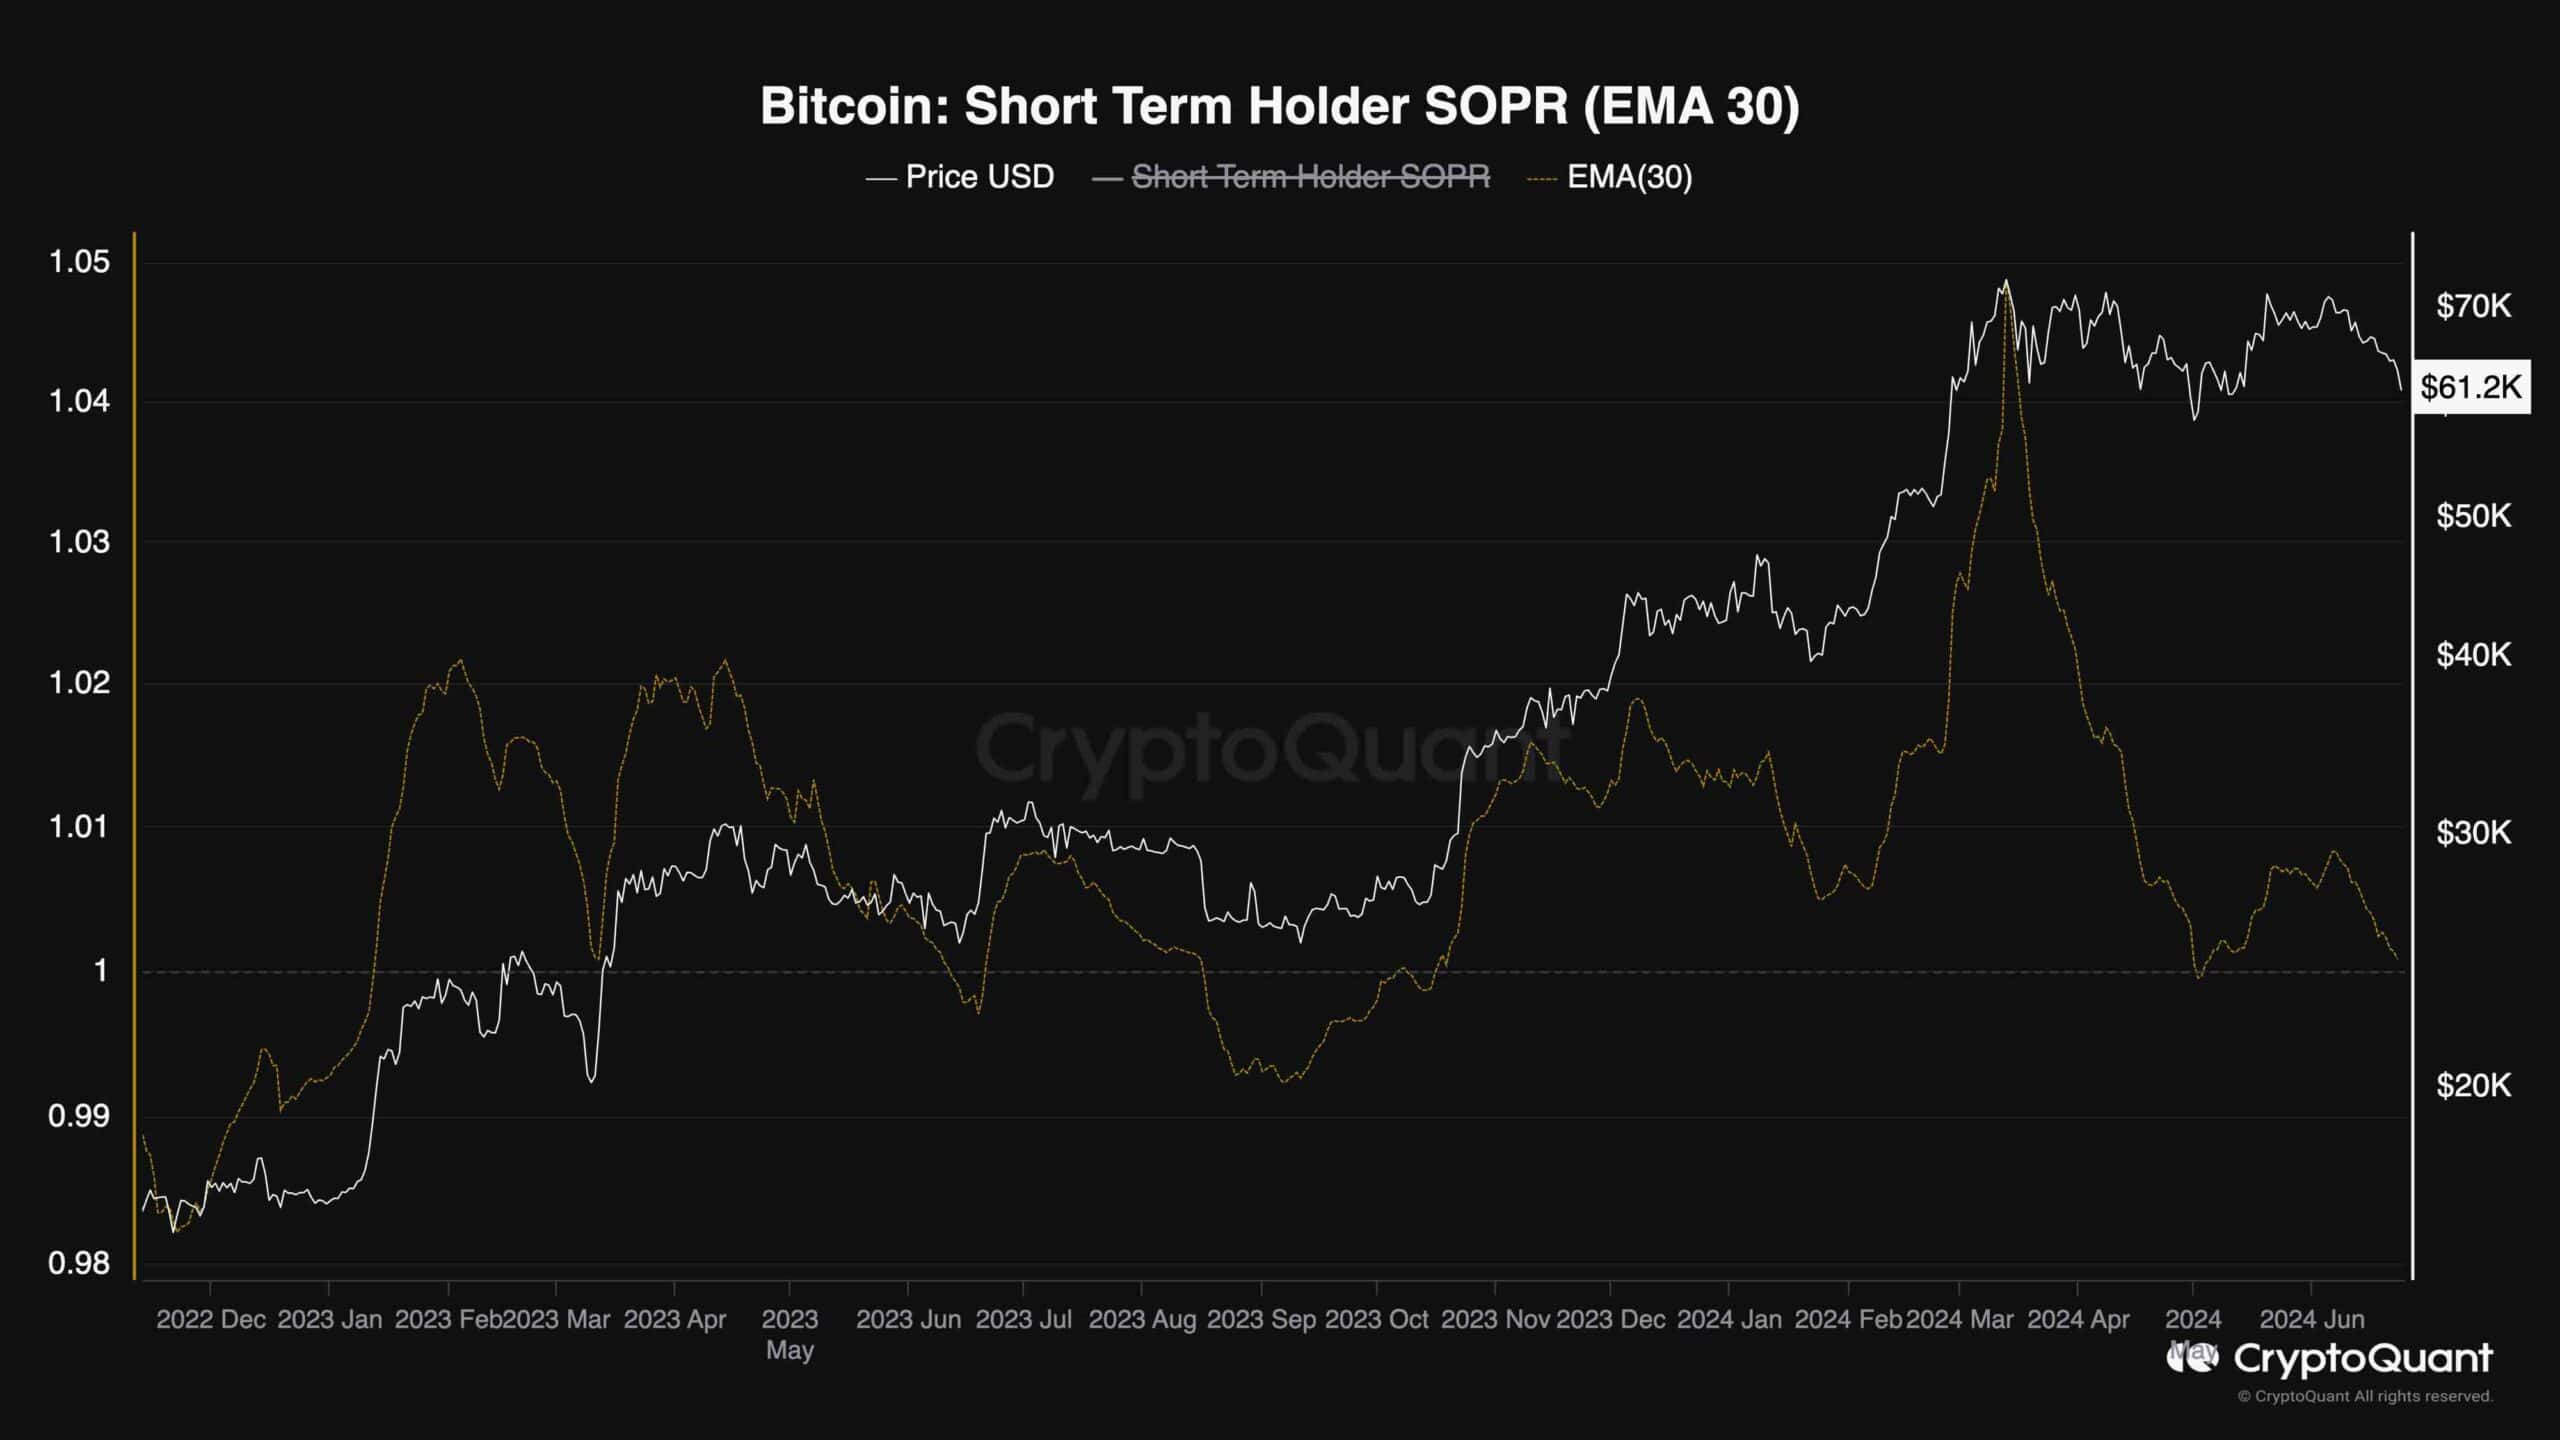
This chart presents the Bitcoin Short-Term Holder SOPR, demonstrating the profit and loss ratio. Values above one indicate that investors are selling at a profit, while values below one point to losses.
The STH SOPR is trending down, as is the BTC price. The short-term holders are on the verge of realizing losses, which would happen if the market drops below $60K.
Yet, this also occurs at the lows during a bull market. So, if we consider the bull market not over yet, the low could be very close.


